
Welcome to FX Primer
FX Primer is a modular market-analysis suite built to bring direction, relative strength, market regime, price extension and key technical areas into one coherent workspace. Its purpose is not to replace decision-making, but to make the information behind that decision easier to read, compare and organize.
Read the market as a system, not as a single signal.
Each FX Primer module answers a different question. Trend Pulse focuses on direction. Currency Flow highlights relative strength. Regime Guard frames expansion and compression. Expansion Bands add price-extension context, while Master Levels brings structural and volume-based reference areas into the same workflow.
What is FX Primer?
FX Primer is designed around a simple idea: no single indicator can describe every part of market context. A directional signal becomes more informative when you also know whether the underlying currencies are strong or weak, whether the market is expanding or compressing, whether price is already stretched, and whether an important technical area is nearby.
Rather than forcing those questions into one opaque score, FX Primer keeps the modules distinct. You can see what each module is contributing, switch modules on or off from the Control Center, and decide how much context you want on the chart.
Direction
Trend Pulse organizes directional state on the current chart and across enabled timeframes.
Relative strength
Currency Flow compares currencies across the selected market context instead of reading a pair in isolation.
Market regime
Regime Guard distinguishes expansion from compression while preserving directional bias information.
Price extension
Expansion Bands help frame how far price has moved relative to its dynamic center.
Structure
Support and resistance zones highlight technical areas that may matter to the current path of price.
Volume context
Volume Profile adds distribution-based information such as POC and Value Area boundaries.
The FX Primer philosophy
FX Primer is not built around the idea that every component must agree before anything can happen. Markets are multi-layered. A shorter timeframe can pull back while a higher timeframe remains directional. A strong currency can meet a major resistance area. A valid directional state can develop while Regime Guard still reports compression.
Those differences are not necessarily contradictions. They are context. The goal of the suite is to make that context visible without forcing it into a single black-box answer.
What FX Primer is not
It is not an automated trading system. FX Primer analyzes and organizes information; it does not replace execution decisions.
It is not a guarantee of profitable trades. No module, alignment state, level or market regime can guarantee a future outcome.
It is not one universal BUY/SELL rule. A directional state is one part of the picture, not a complete trade plan by itself.
It does not require every module to agree. Different modules describe different dimensions of the same market.
Use each module as a question. Direction? Strength? Regime? Extension? Structure? Volume? The quality of the analysis comes from understanding the answers, not from waiting for one perfect color combination.
Getting Started
This section gets FX Primer from the download package to a working chart with the recommended first-launch configuration. The final release can use a short installation video for the mechanical steps and keep this page focused on what the user actually needs to verify.
What is included
The FX Primer package contains three core components. The main Suite provides the analytical workspace, Regime Guard adds the dedicated market-regime subwindow, and License Core activates and keeps your FX Primer license valid while you use the product.
FX Primer Suite
The main chart indicator containing the Control Center and the integrated FX Primer analytical modules.
FX Primer Regime Guard
The companion indicator responsible for the dedicated expansion/compression subwindow.
FX Primer License Core
The licensing component used to activate FX Primer and keep the license valid while the suite is running.
System requirements
MetaTrader 4/5 desktop. FX Primer is designed for the desktop desktop versions of MetaTrader 4/5.
Windows environment. The interface uses standard Windows-compatible fonts and standard MetaTrader 4/5 chart objects.
WebRequest permission. MetaTrader must allow requests to the official FX Primer URL so License Core can verify the license.
Broker price history. Multi-timeframe modules need the relevant historical data to be available in the terminal.
Reasonable chart resources. Lower-performance systems can later use a lighter visual-history setting or disable unused modules.
Installation
Install and activate FX Primer on MetaTrader 4/5
Final asset: a short unlisted installation video covering file placement, WebRequest permission, license activation, Suite setup and Regime Guard.
Keep your FX Primer License Key available. You will enter it once inside FX Primer License Core during activation.
Install the FX Primer files
Copy FX Primer Suite, FX Primer Regime Guard and FX Primer License Core into the correct MetaTrader 4/5 indicator folder.
Allow the FX Primer WebRequest
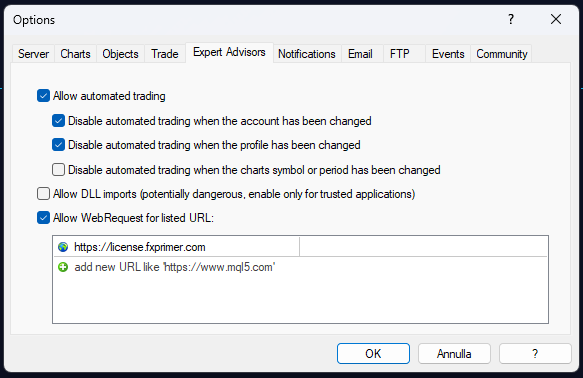
Open MetaTrader settings and add the official FX Primer URL to the list of allowed WebRequest addresses.
Enter your License Key
Open FX Primer License Core and paste the License Key supplied with your purchase into its license field.
Attach License Core
Mount FX Primer License Core on a chart and allow it to activate your license.
Attach FX Primer Suite
Load the main FX Primer Suite on the chart once the license is active.
Add Regime Guard when needed
Attach FX Primer Regime Guard to the chart when you want the dedicated expansion/compression subwindow.
First launch
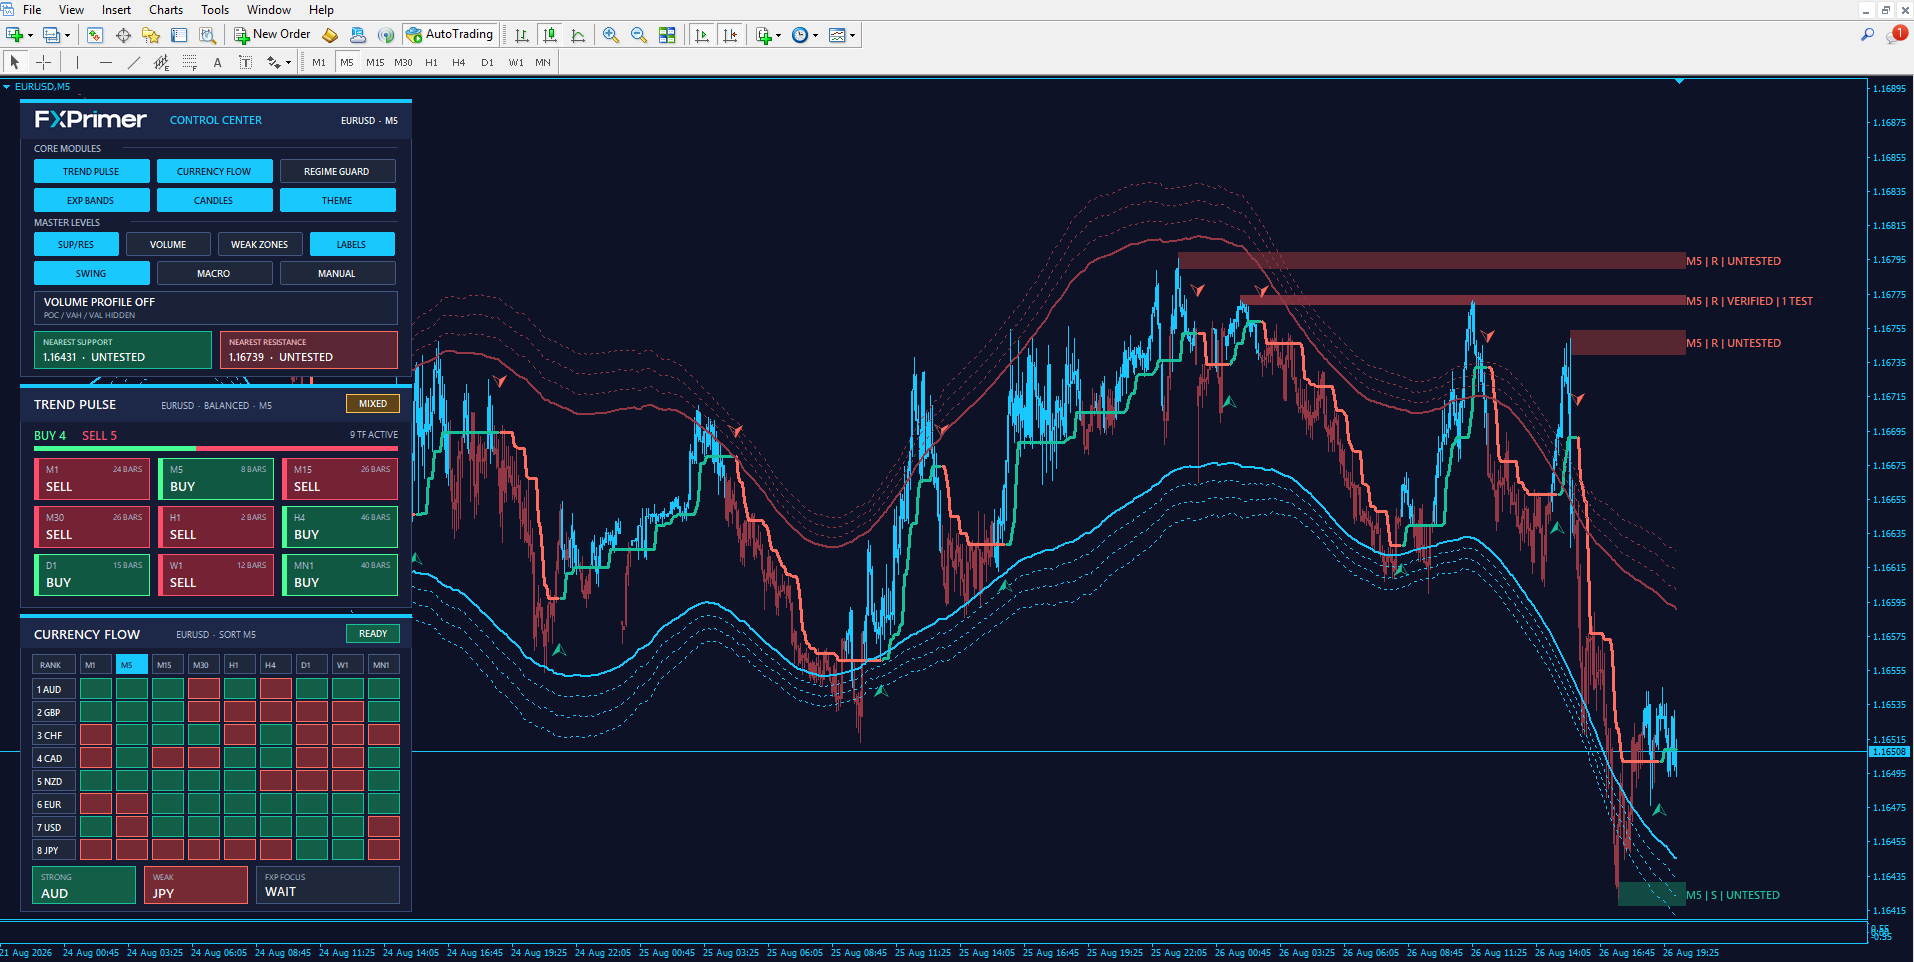
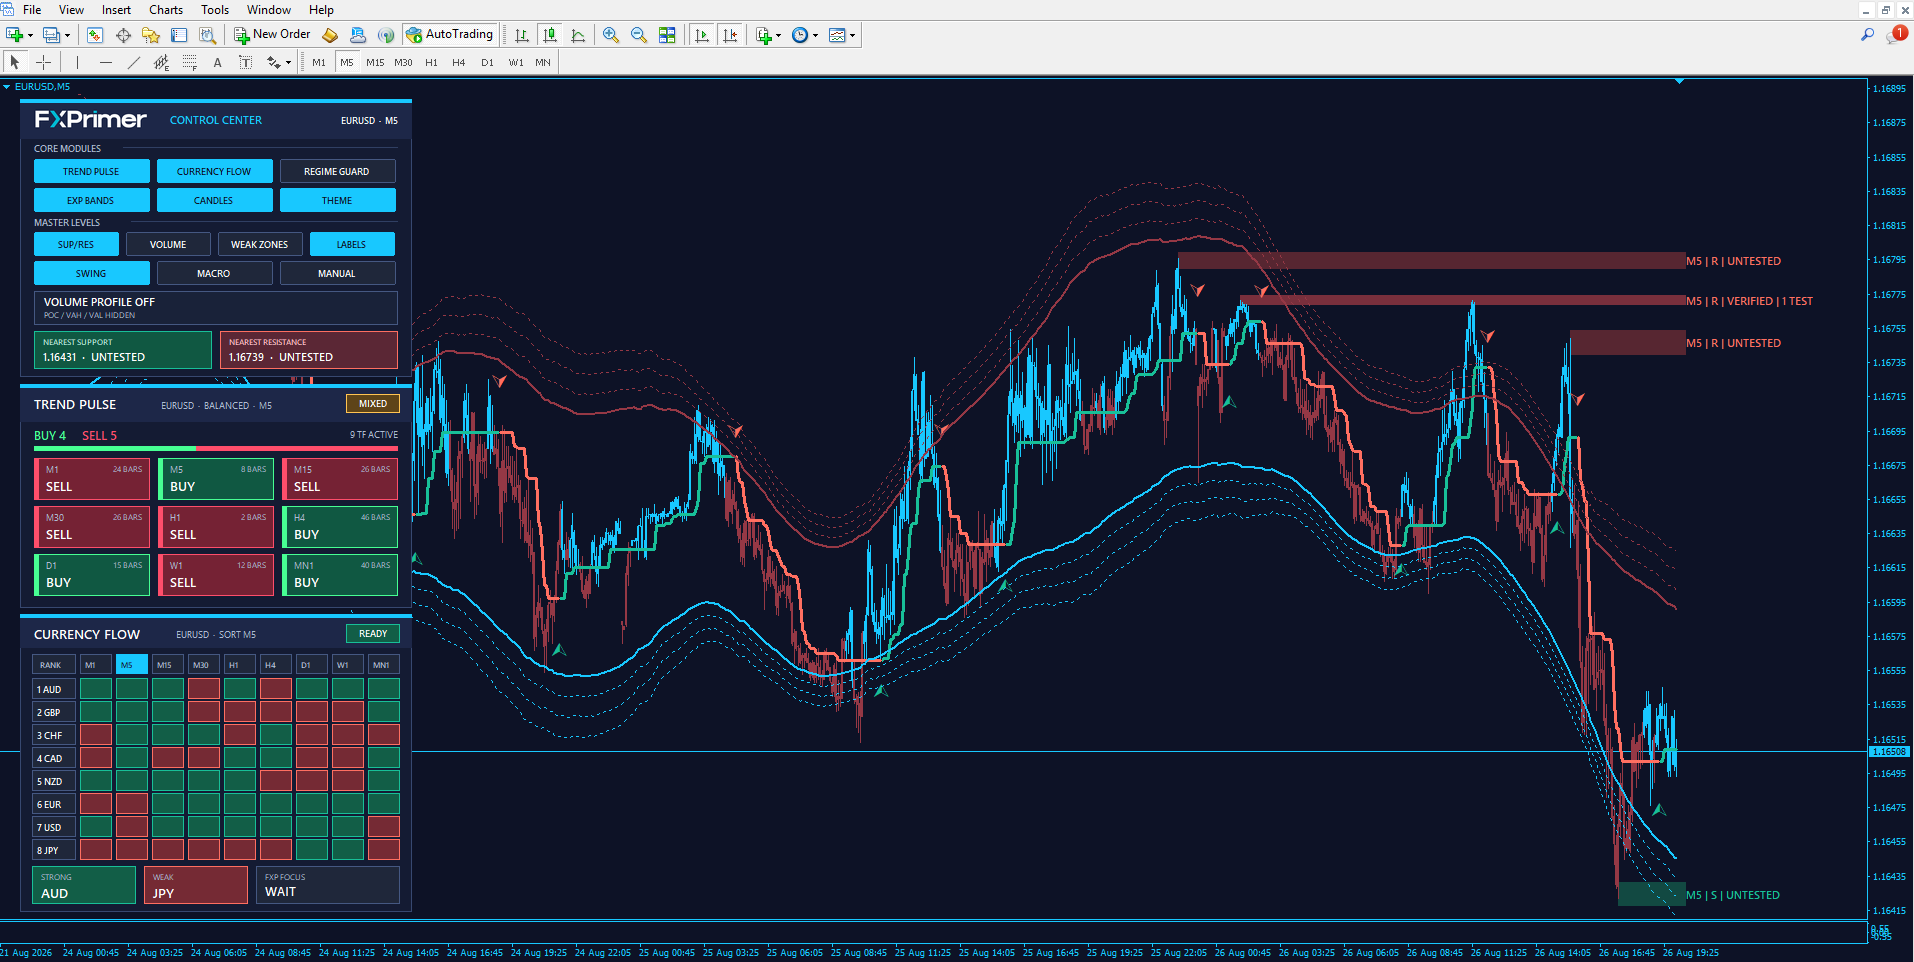
On a normal first launch, FX Primer License Core should already be mounted and the license should be active before the main Suite is loaded. Once the Suite is attached, the chart should immediately adopt the FX Primer workspace: the Control Center appears at the top-left, followed by Trend Pulse and Currency Flow. The chart overlays and theme are then applied according to the default configuration.
FX Primer License Core is not an analytical module and does not add market information to the workspace. Its role is simply to activate and maintain the FX Primer license while the product is in use.
Recommended default setup
FX Primer starts with the core directional and strength tools visible, while more situational layers remain available from the Control Center when needed.
Quick Start
You do not need to understand every FX Primer module before using the workspace. Start by learning three questions and add the remaining tools as you become familiar with the suite.
What is direction doing?
Start with Trend Pulse. Read the current directional state and how the enabled timeframes are distributed.
Which currencies are strong?
Use Currency Flow to understand relative strength rather than evaluating a pair in isolation.
What kind of market is this?
Enable Regime Guard when you want expansion/compression context before interpreting directional movement.
The next parts of the documentation will explain each module separately before showing how they can be combined. Understanding what a module measures is more useful than memorizing a rigid checklist.
The FX Primer Workspace
Before learning the individual modules, it helps to understand how the workspace is organized. FX Primer separates persistent chart context from dashboard information, so the user can decide what stays visible and what is activated only when needed.
Workspace overview
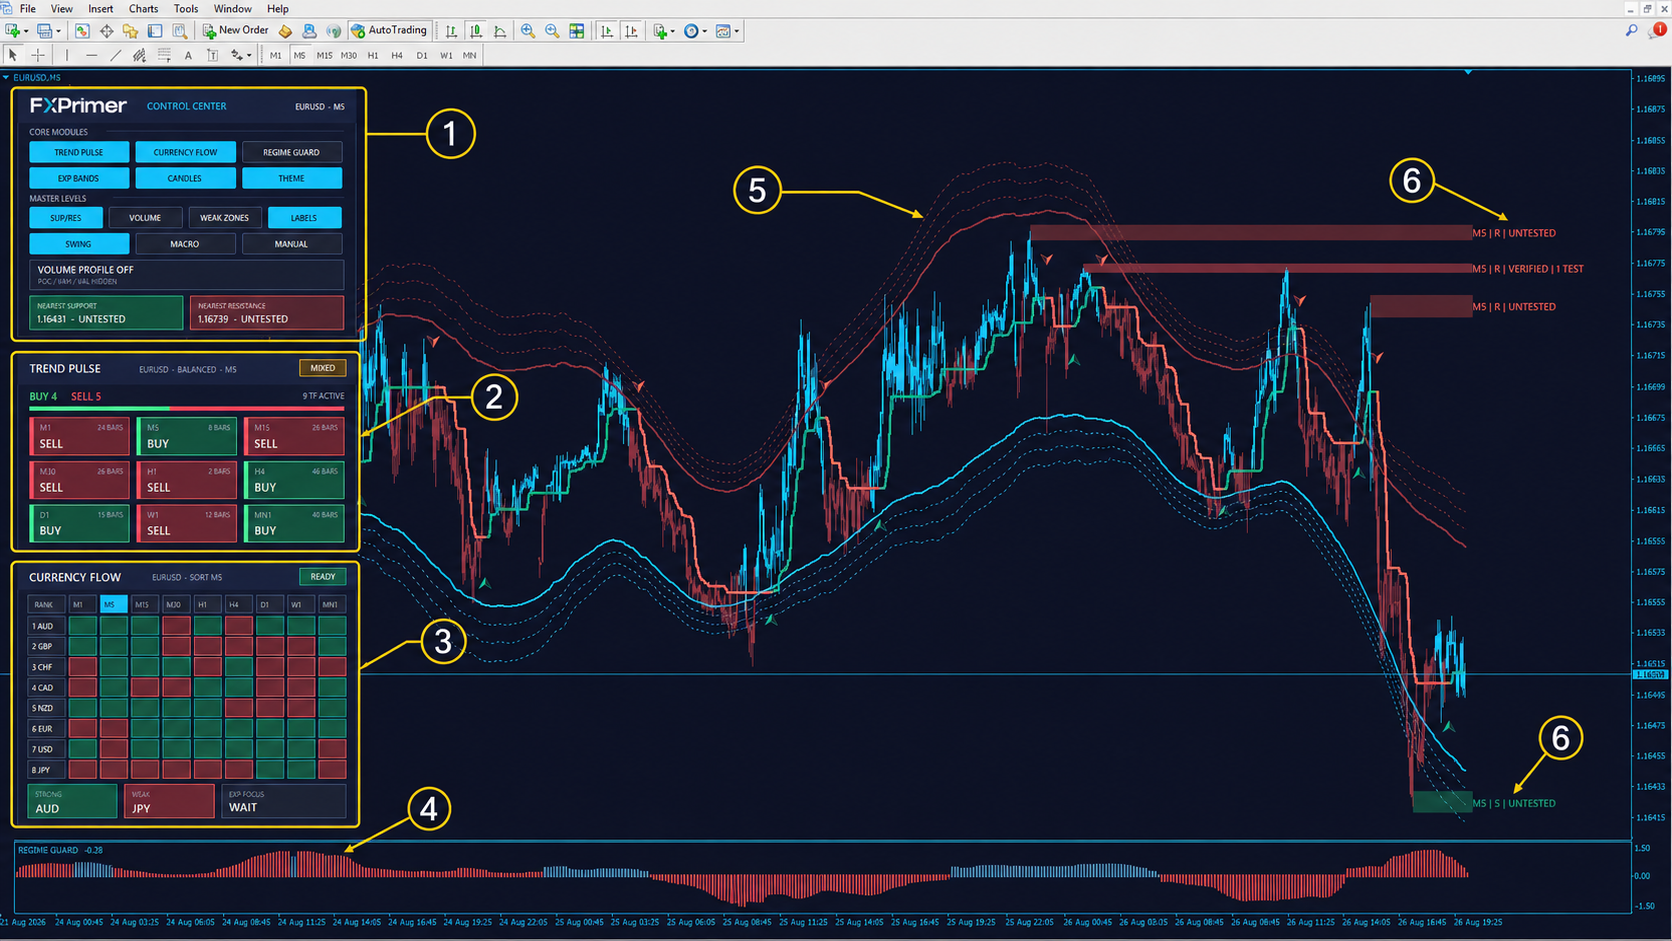
Control Center
The operational hub used to show, hide and configure the major FX Primer modules directly from the chart.
Trend Pulse
The directional module, including current-chart state, reversal arrows, colored candles and multi-timeframe context.
Currency Flow
The relative-strength matrix used to compare currencies and identify current strong/weak relationships.
Regime Guard
A separate subwindow dedicated to expansion, compression and directional bias.
Expansion Bands
Dynamic upper and lower bands used to frame price extension relative to the underlying center.
Master Levels
Support/resistance zones and Volume Profile tools used to add structural and distribution-based context.
Control Center
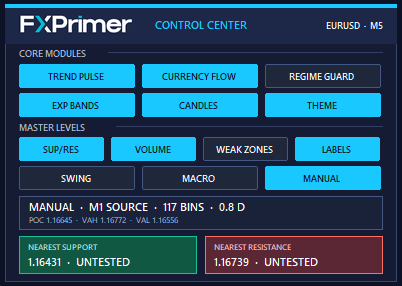
The Control Center is the first dashboard in the workspace. It is designed to reduce the need to reopen the MetaTrader 4/5 Inputs window whenever you want to change the active analysis layer. Core modules and Master Levels controls can be switched directly from the chart.
Trend Pulse
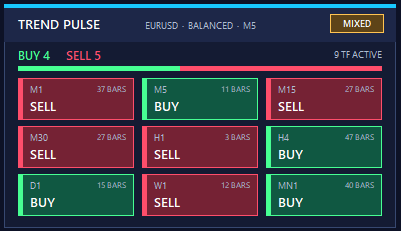
Trend Pulse sits directly below the Control Center and acts as the directional layer of the workspace. Its compact grid lets you see how direction is distributed across the enabled timeframes without opening separate charts for every period.
Currency Flow
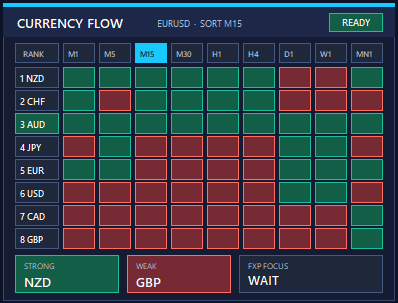
Currency Flow is the strength layer of the workspace. Instead of asking only whether one chart looks bullish or bearish, it compares the enabled currencies and timeframes to build a relative ranking. The bottom cards summarize the current strongest currency, weakest currency and FXP Focus relationship.
Regime Guard
Regime Guard is intentionally separated from the main dashboard stack because it uses its own MetaTrader 4/5 subwindow. When disabled from the Control Center, the companion window collapses to minimize its footprint. When enabled, it expands and displays the current expansion/compression state.
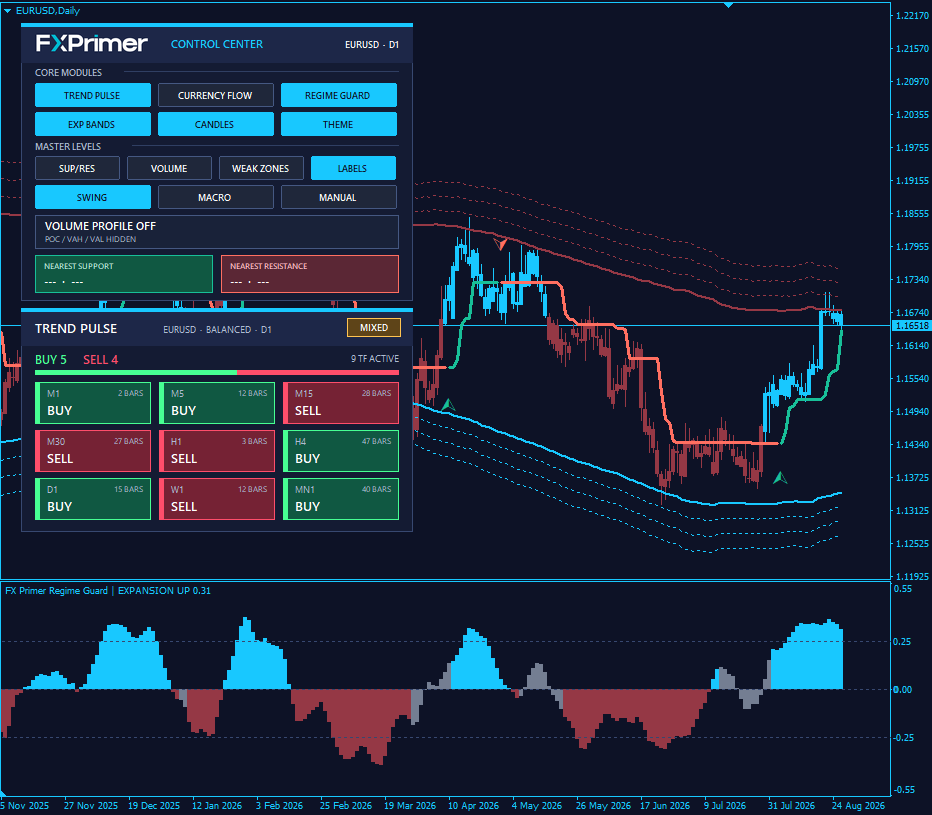
Chart overlays
Some FX Primer information lives directly on price rather than inside a dashboard. This includes the Trend Pulse line and arrows, colored candles, Expansion Bands and the optional Master Levels overlays. Keeping those elements on the chart makes them readable in direct relation to price.
Trend Pulse overlays
Directional line, reversal arrows and the optional FX Primer colored-candle layer.
Expansion Bands
Four upper and four lower dynamic bands designed to make increasing price extension visible.
Support & Resistance
Optional zones and compact labels published by the Master Levels structure engine.
Volume Profile
Optional histogram and reference levels used to visualize concentration across the selected profile range.
How to read the workspace
The workspace is intentionally layered. You do not need to process every element at the same time. A useful first habit is to move from broad context to specific location.
Direction & strength
Start with Trend Pulse and Currency Flow to understand the directional picture and relative currency relationship.
Regime & extension
Use Regime Guard and Expansion Bands when you need to understand the environment around that movement.
Location
Use Master Levels when the exact position of price relative to structure and volume becomes important.
Control Center
The Control Center is the operational layer of FX Primer. It lets you change the active market views directly from the chart, so you can move from a clean directional workspace to a more detailed structural or volume view without repeatedly reopening the platform Inputs window.
Not a market question. The Control Center answers a workflow question: which FX Primer layers do I want visible right now?
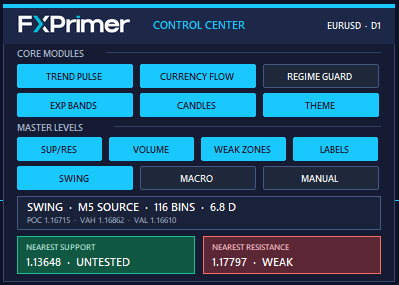
Core Modules
The first group controls the main FX Primer analysis layers and the visual presentation of the chart.
Trend Pulse
Shows or hides the directional dashboard and its associated Trend Pulse chart elements.
Currency Flow
Shows or hides the relative-strength dashboard.
Regime Guard
Expands or collapses the dedicated regime subwindow and its histogram.
Expansion Bands
Shows or hides the eight dynamic price-extension bands on the chart.
Candles
Enables or disables the FX Primer colored-candle layer without changing the underlying Trend Pulse logic.
Theme
Applies or removes the FX Primer chart appearance independently from the colored candles.
Master Levels controls
The second group controls the structural and volume-based layers. These tools are more situational, so they can remain off until you need more information about price location.
Support / Resistance
Shows or hides the Master Levels structural zones.
Volume
Shows or hides the Volume Profile histogram and its reference levels.
Weak Zones
Controls whether lower-strength support/resistance zones remain visible.
Labels
Shows or hides the compact text labels attached to Master Levels zones.
Volume Profile modes
Swing
A rolling profile built around the most recent trading sessions and designed as the standard working view.
Macro
An adaptive wider profile intended for higher-timeframe context and broader market structure.
Manual
A draggable profile whose range is defined directly on the chart by the user.
Live information areas
The Control Center is not limited to switches. When the related modules are active, it also surfaces compact information so you can read important levels without searching for them manually on the chart.
Displays the closest published support zone and its current classification.
Displays the closest published resistance zone and its current classification.
Shows the active mode, source period, profile size and current profile statistics.
Surfaces the key Volume Profile reference prices when the volume layer is active and ready.
Turning a visual layer off removes it from the active workspace; it does not redefine what the other FX Primer modules mean.
Trend Pulse
Trend Pulse is the directional layer of FX Primer. It combines a current-chart trend view with a multi-timeframe dashboard so direction can be read as a structure rather than as one isolated signal.
What direction is the market currently expressing, and how consistent is that direction across the timeframes I care about?
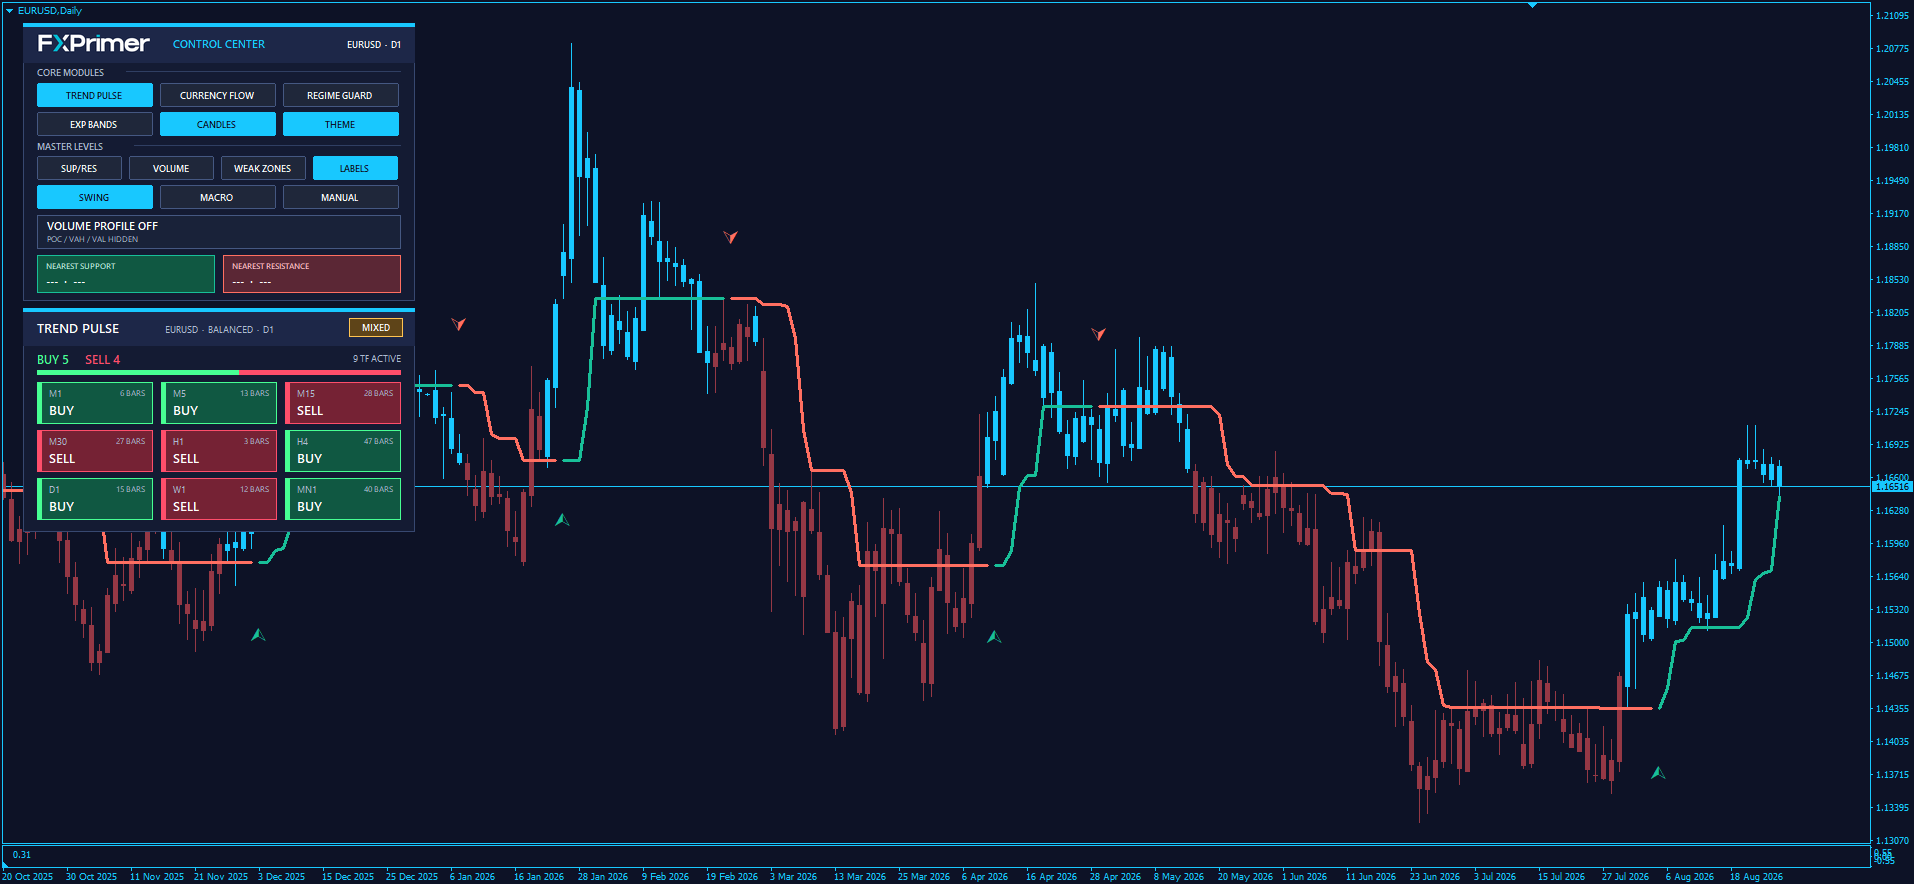
Trend direction on the chart
Trend Pulse draws a directional line directly on price. The line changes state with the current directional regime and is paired with reversal arrows when that state changes. The chart view is intentionally simple: the line tells you the active direction, while the arrow marks the transition into a new state.
The current Trend Pulse state is directional to the upside. It describes context; it is not an instruction to enter immediately.
The current Trend Pulse state is directional to the downside. The same distinction applies: state first, execution decision second.
Marks the bar where Trend Pulse changes from one directional state to the other.
Provide a faster visual read of bullish or bearish candle context while remaining separately switchable from the Control Center.
The multi-timeframe dashboard
The dashboard reads the enabled timeframes from M1 through MN1 and gives each timeframe its own BUY or SELL state. This makes it possible to see whether the current chart is moving with a broader directional structure or against part of it.
MIXED
MIXED means the enabled timeframes are not all in the same state. This is normal. A lower timeframe can turn before a higher timeframe, or a short-term pullback can develop inside a broader directional move.
Full alignment
Full alignment occurs when every enabled Trend Pulse timeframe is in the same BUY or SELL state. It represents stronger directional agreement across the selected timeframe set, but it should not be interpreted as a guarantee that price will continue in that direction.
Response modes
Trend Pulse provides three user-facing response profiles. They do not change what Trend Pulse is trying to measure; they change how quickly the module reacts to market movement.
Reactive
Designed for users who prefer a more responsive directional read and are comfortable with more frequent state changes.
Balanced
The standard FX Primer profile. It aims to balance responsiveness with a cleaner, more stable directional structure.
Stable
Designed for users who prefer fewer directional changes and are willing to accept a slower response.
Timeframe interaction
The timeframe cards are interactive. Clicking a card changes the chart to that timeframe, making it easy to inspect the exact market structure behind a dashboard state without manually selecting the period from the platform toolbar.
Notifications
Trend Pulse can notify you about relevant directional events according to the enabled notification settings. Full multi-timeframe alignment can be used as a notification condition, and supported builds can also surface current-timeframe state changes. FX Primer is designed to avoid replaying old historical events as if they were new live signals.
A BUY or SELL state does not define entry price, stop placement, risk, market regime or nearby structural obstacles. Those questions belong to other parts of the FX Primer workspace.
Currency Flow
Currency Flow is the relative-strength layer of FX Primer. Instead of looking only at one Forex pair, it compares the enabled currencies across multiple timeframes and turns that information into a compact ranking.
Which currencies are currently showing greater relative strength, which are weaker, and how consistent is that relationship across timeframes?
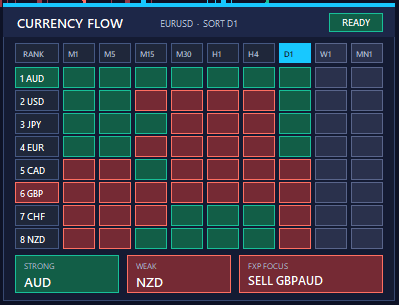
Understanding the matrix
Each row represents one enabled currency. Each timeframe cell summarizes that currency's relative directional behavior within the Currency Flow calculation. A currency with stronger positive readings across the selected context naturally tends to rank higher, while a currency with weaker readings tends to move toward the bottom.
Indicate relative strength for that currency on the corresponding timeframe.
Indicate relative weakness for that currency on the corresponding timeframe.
Orders currencies using the selected sort context, helping the strongest and weakest relationships stand out quickly.
Shows whether a currency is behaving consistently or differently across shorter and longer periods.
Strong, Weak and FXP Focus
The bottom summary area turns the matrix into three fast reference points.
Strong
The currency currently at the strongest side of the enabled ranking.
Weak
The currency currently at the weakest side of the enabled ranking.
FXP Focus
A compact pair relationship built from the current strong-versus-weak context when a valid Forex combination is available.
Sort timeframe
The sort setting determines which timeframe provides the main ordering reference for the currency ranking. The matrix still shows the broader multi-timeframe picture; the sort simply determines how the rows are prioritized at that moment.
Relative strength is dynamic. A currency can remain broadly strong while another currency overtakes it on the selected sort timeframe. That does not make the previous reading “wrong”; it means the relationship has changed.
Historical data and broker symbols
Currency Flow depends on the platform having access to the required Forex pairs and timeframe history. FX Primer automatically works with normal broker symbol prefixes and suffixes where possible. If required history is missing, the module may need the platform to load that data before the dashboard can produce a complete ranking.
Strong versus weak is not a complete entry signal. It says something important about relative currency behavior, but it does not tell you whether price is extended, compressed, sitting at resistance, or offering acceptable risk.
Regime Guard
Regime Guard adds a second dimension to directional analysis: it helps distinguish a market that is expanding from one that is compressed, while still showing the underlying directional bias.
Is the market currently expanding or compressing, and is the underlying bias leaning upward or downward?
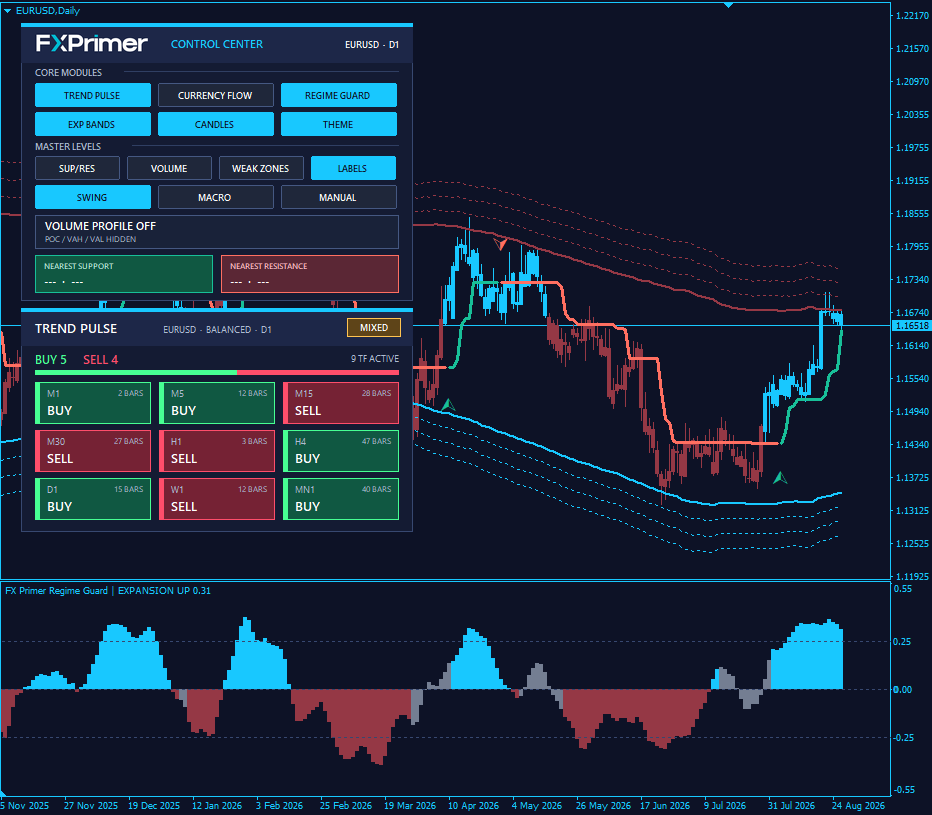
The four visible states
The regime is in expansion and directional bias is positive.
The regime is in expansion and directional bias is negative.
The market is compressed, but the internal directional bias remains positive.
The market is compressed, but the internal directional bias remains negative.
Expansion versus compression
Regime Guard evaluates the current market environment and separates two broad conditions: expansion, where price movement is showing greater directional activity, and compression, where the market is operating in a tighter, less expansive state.
The histogram is designed to make those regime changes easy to recognize visually without requiring the user to interpret the underlying calculations. The directional side of the display simply adds an upward or downward bias to the current regime state.
Technical note · how much should I know?
Regime Guard uses a fixed internal engine and does not require manual calibration. For normal use, the important information is the visible state itself: expansion, compression and directional bias.
Why Regime Guard matters
The same Trend Pulse state can mean something different depending on regime. A bullish directional structure developing during expansion is not the same environment as a bullish structure developing while volatility remains compressed. Regime Guard exists to make that distinction visible.
Compression does not mean “never trade,” and expansion does not guarantee continuation. Regime Guard classifies the environment; it does not predict the next candle.
Expansion Bands
Expansion Bands provide a visual measure of price extension. They are designed to answer a different question from support and resistance: not “where is structure?”, but “how far has price moved from its dynamic center?”
Is price trading near its normal dynamic range, or has the current move become increasingly extended?
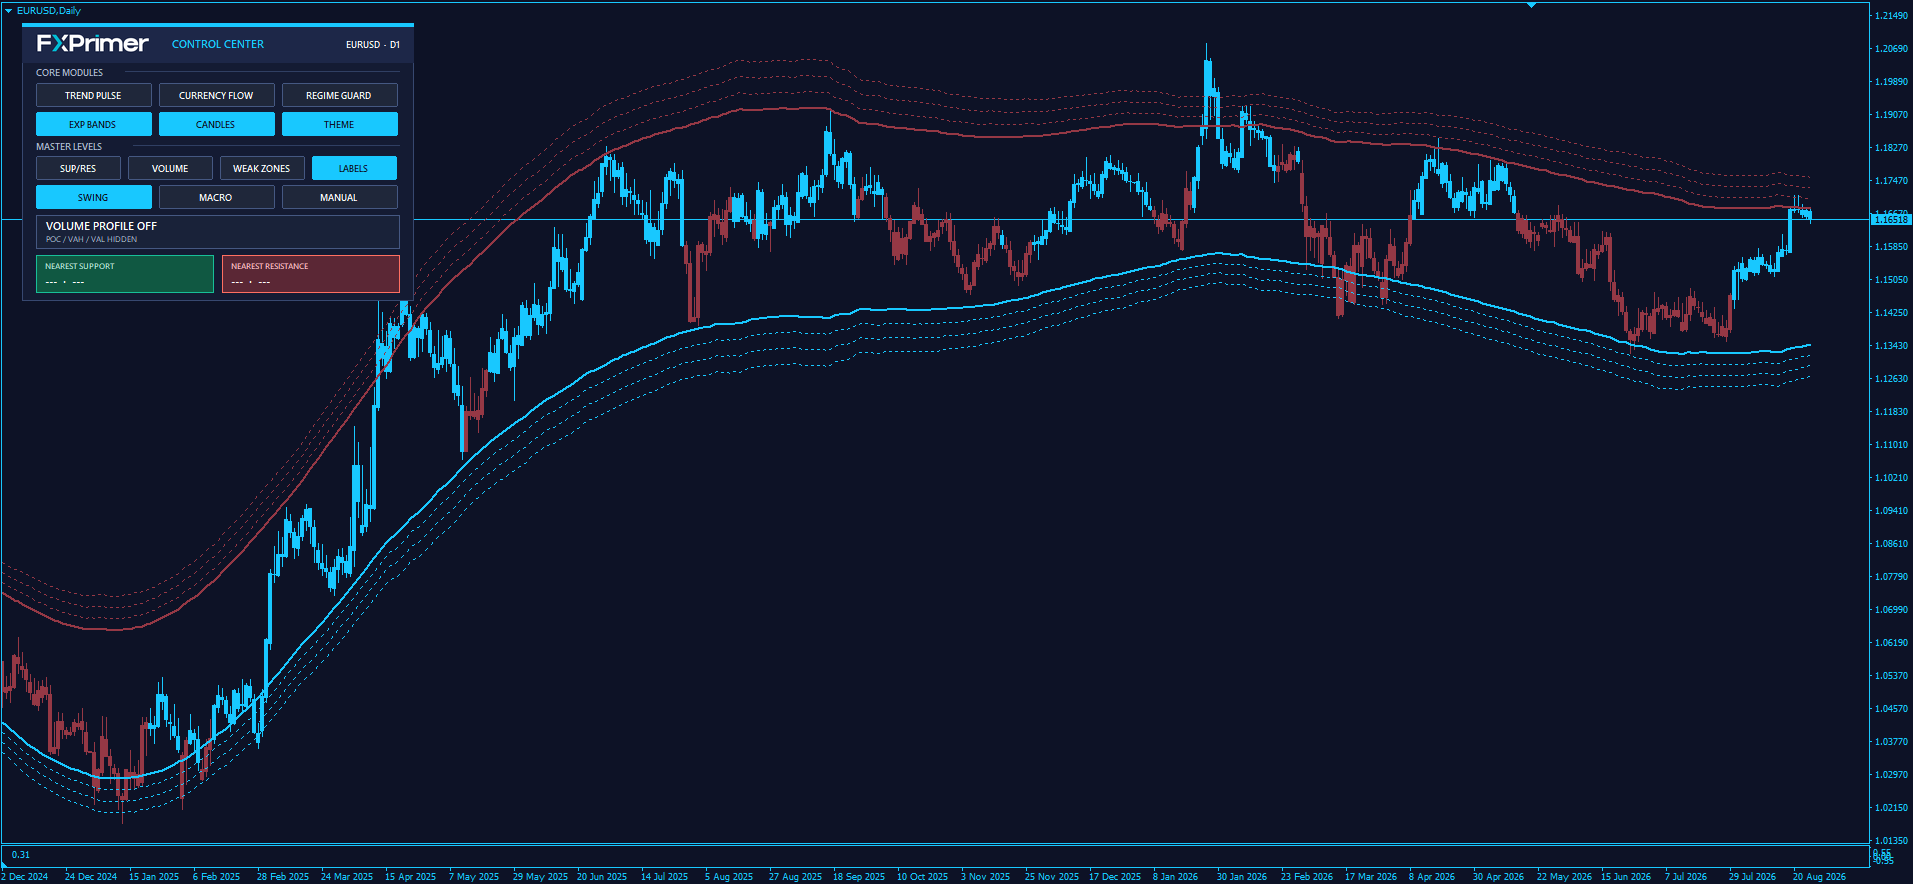
The extension layers
FX Primer draws four upper bands and four lower bands. The first layer is visually emphasized with a thicker continuous line, while the three outer layers use lighter dotted references. Moving from the inner layer toward the outer layers represents progressively greater extension from the dynamic center.
Upper and lower bands
The upper band family uses the FX Primer bearish extension color, while the lower band family uses the FX Primer cyan extension color. The colors help orientation; they do not imply that touching an upper band is automatically a SELL or touching a lower band is automatically a BUY.
Expansion Bands are not support and resistance
Support and resistance zones are derived from market structure and historical interaction. Expansion Bands are dynamic distance references that move with price and help visualize extension. They may overlap with structural areas, but they answer different analytical questions.
Recent bars can adjust
Expansion Bands are dynamic by design. The most recent portion can adjust as new market data arrives, so they should be treated as a context tool rather than as fixed historical levels.
An outer-band touch is not a guaranteed reversal. Strong directional expansion can remain extended and can travel beyond an outer band before normalizing.
Master Levels — Support & Resistance
The support and resistance side of Master Levels maps technical price zones and classifies them by their current structural state. It is designed to add location to the directional and regime information provided by the rest of FX Primer.
Where are the nearest technically relevant price zones, and how established is each zone within the current structure?
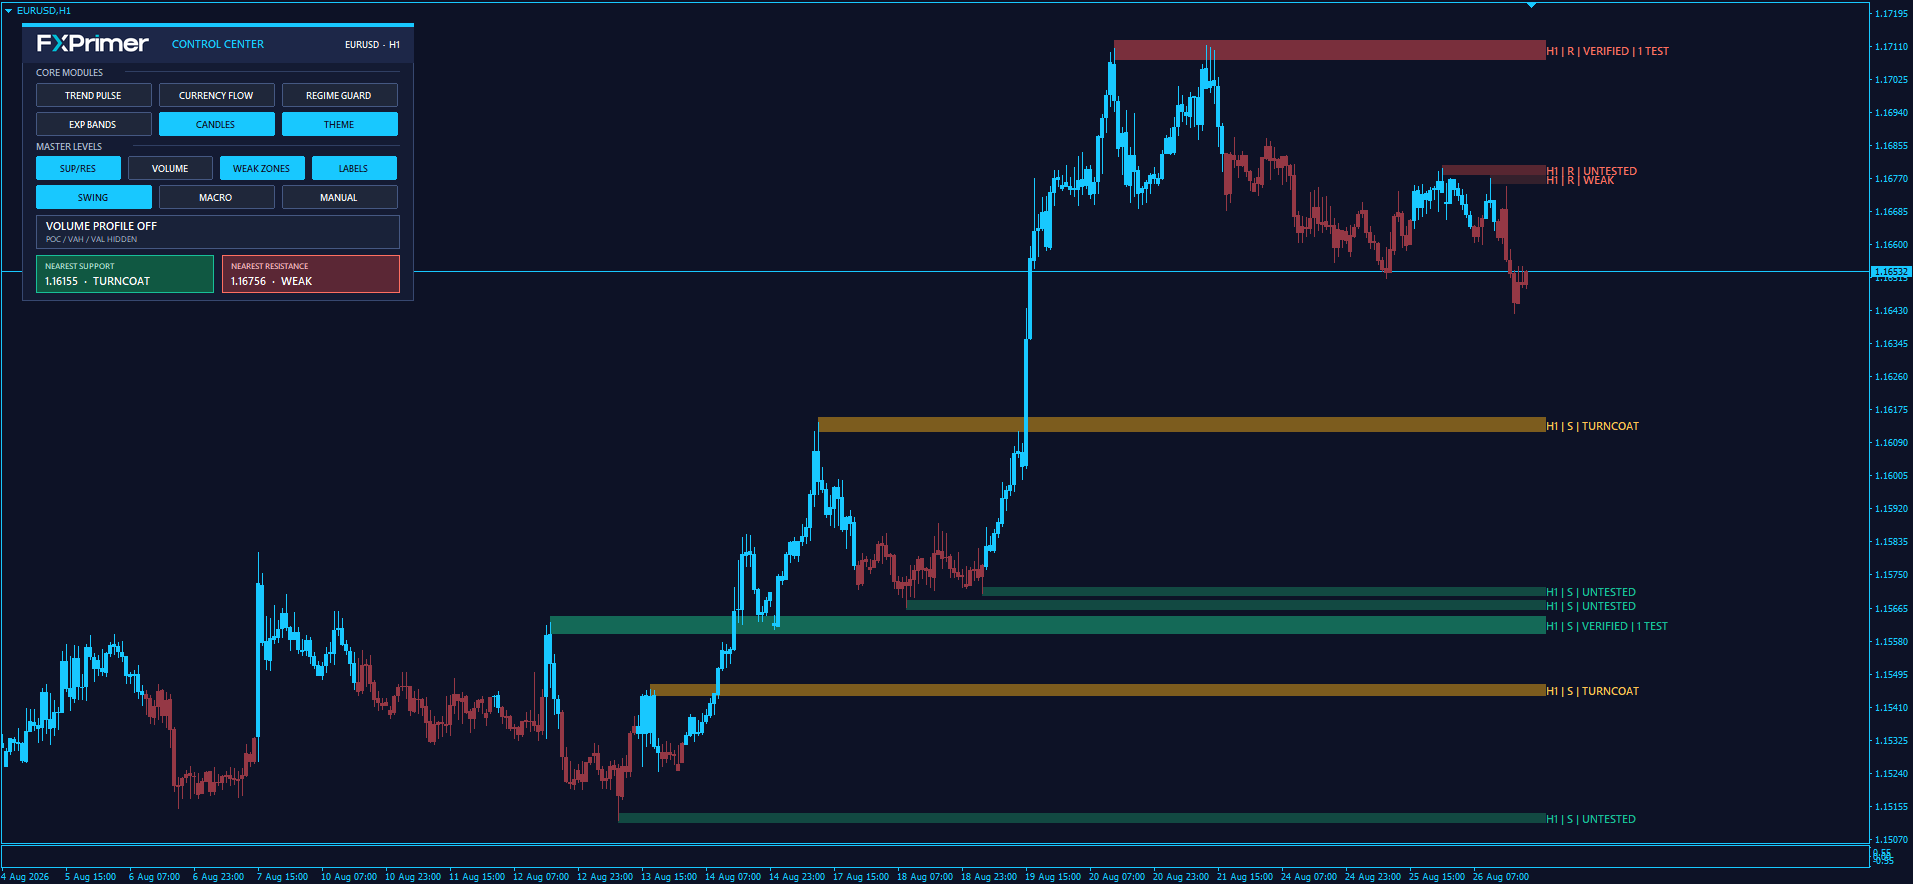
Support and resistance zones
Master Levels does not draw a single thin price line. It works with zones, because market reactions rarely occur at one exact tick. The engine scans historical price structure and publishes areas that may be relevant as support below price or resistance above price.
Zone classifications
Weak
A lower-strength zone that has not yet developed the same structural evidence as stronger classifications.
Untested
A recognized zone whose current relevance has not yet been meaningfully retested after formation.
Verified
A zone with additional market interaction supporting its relevance.
Proven
A more established zone with stronger historical evidence inside the Master Levels classification logic.
Turncoat
A role-reversal zone where an area previously acting as support or resistance has changed structural role.
A stronger label means the engine has more structural evidence for that zone. It does not mean the level cannot break.
Weak Zones and Labels
Weak Zones lets you decide whether lower-strength areas should remain visible. Labels controls the compact text classification displayed beside each zone. Both can be changed directly from the Control Center.
Nearest Support and Resistance
When Master Levels is active, FX Primer can publish the nearest support and nearest resistance to the Control Center together with their classifications. This provides immediate location context without forcing you to scan every visible zone manually.
Master Levels versus Expansion Bands
Master Levels is about structure. Expansion Bands are about extension. A price can be highly extended without being at a major structural zone, or it can approach a major support/resistance area while still trading inside a normal dynamic range.
A support zone does not guarantee a bounce, and resistance does not guarantee rejection. Zones identify potentially important locations; the market still decides whether to respect, break or transform them.
Master Levels — Volume Profile
Volume Profile shows how market activity is distributed across price inside a selected range. It is less about direction and more about where trading activity has concentrated.
At which price areas has the selected market range concentrated more activity, and where are the main reference levels inside that distribution?
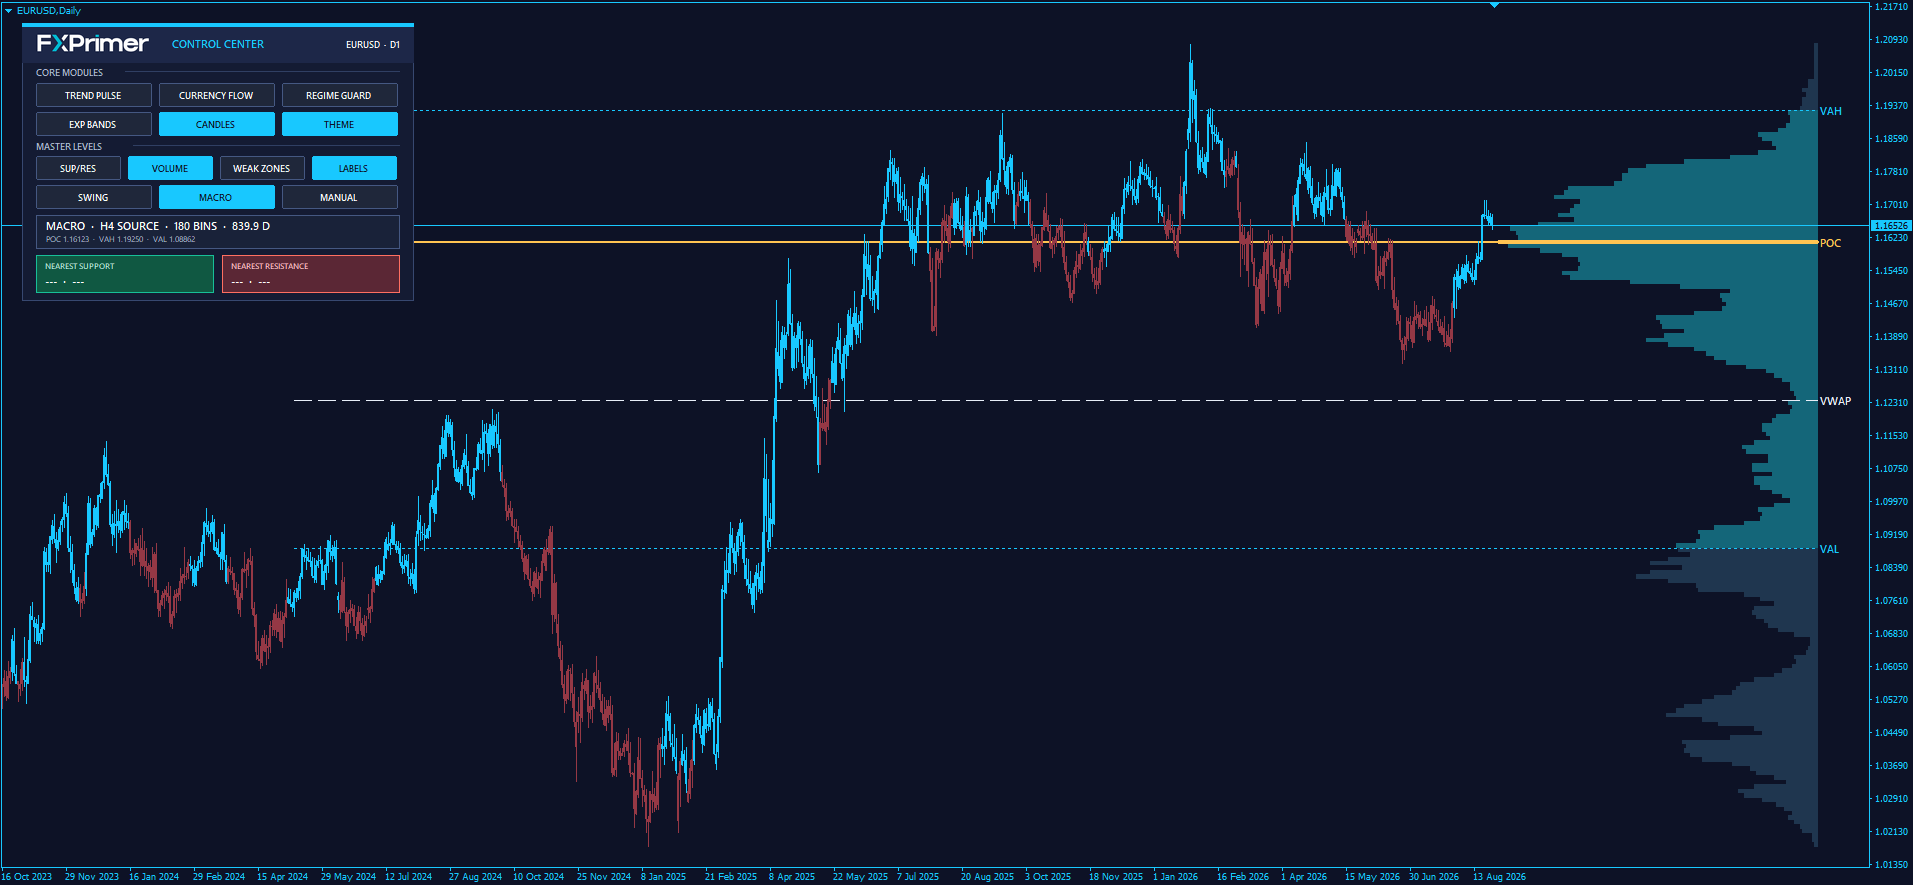
Reading the histogram
The horizontal histogram is divided into price bins. A longer bar means more activity was recorded around that price area within the selected profile range. A shorter bar means less activity. The profile is therefore a map of where activity concentrated, not a prediction of where price must move next.
Key reference levels
Value Area
FX Primer uses a configurable Value Area percentage, with 70% as the standard setting. VAH and VAL mark the upper and lower boundaries of the price region containing that selected share of the profile's activity.
Swing, Macro and Manual
Swing
Uses a rolling recent-market window designed for normal day-to-day contextual analysis.
Macro
Automatically expands the analysis range for higher-timeframe context and broader structural reading.
Manual
Lets you define a custom start and end range directly on the chart and build the profile around that specific move.
How to think about Volume Profile
Imagine price moving vertically while the profile records how much market activity accumulated at each horizontal price band. High-volume areas show where the market spent or generated more activity. Low-volume areas show where activity was lighter. POC, VAH and VAL summarize the most important parts of that distribution.
It becomes especially useful when combined with the directional, regime and structural layers of FX Primer because it helps answer “where is price?” after other modules have helped answer “what is the market doing?”
POC, VAH and VAL are reference prices, not automatic entry or reversal levels. Price can trade through them, rebalance around them or move away from them depending on the broader market context.
Putting FX Primer Together
FX Primer becomes most useful when its modules are read as different layers of the same market, not as separate indicators competing to produce the “right” signal. This chapter introduces a practical analysis sequence and several example situations without turning the suite into a rigid entry system.
Start with direction, add context, then evaluate location. FX Primer is designed to move from the broad market picture toward the exact place where price is trading.
A practical analysis sequence
You do not have to use this order every time, but it provides a clean starting framework for understanding how the modules relate to one another.
Read direction
Start with Trend Pulse. Identify the current chart state, the distribution of BUY and SELL timeframes, and whether the directional picture is mixed or broadly aligned.
Check relative strength
Use Currency Flow to see whether the currencies involved in the pair are showing a supportive strong-versus-weak relationship or a more balanced picture.
Identify the market regime
Enable Regime Guard when you want to know whether the current directional picture is developing during expansion or compression.
Check price extension
Expansion Bands help you see whether price remains inside a normal dynamic area or has already moved into progressively more extended territory.
Evaluate structure
Use Support & Resistance when exact price location matters. A directional move approaching a major zone deserves a different reading from the same move in open space.
Add volume context
Use Volume Profile when you want to understand where activity concentrated inside the selected range and how price is interacting with POC and Value Area references.
You are not required to activate every module or wait for every layer to agree. The sequence is meant to organize thinking, not to create a mechanical entry rule.
Scenario A — Directional expansion
A directional move with supportive context
ExampleImagine a pair where Trend Pulse is broadly bullish, Currency Flow shows the base currency relatively strong and the quote currency relatively weak, and Regime Guard is in Expansion Up.
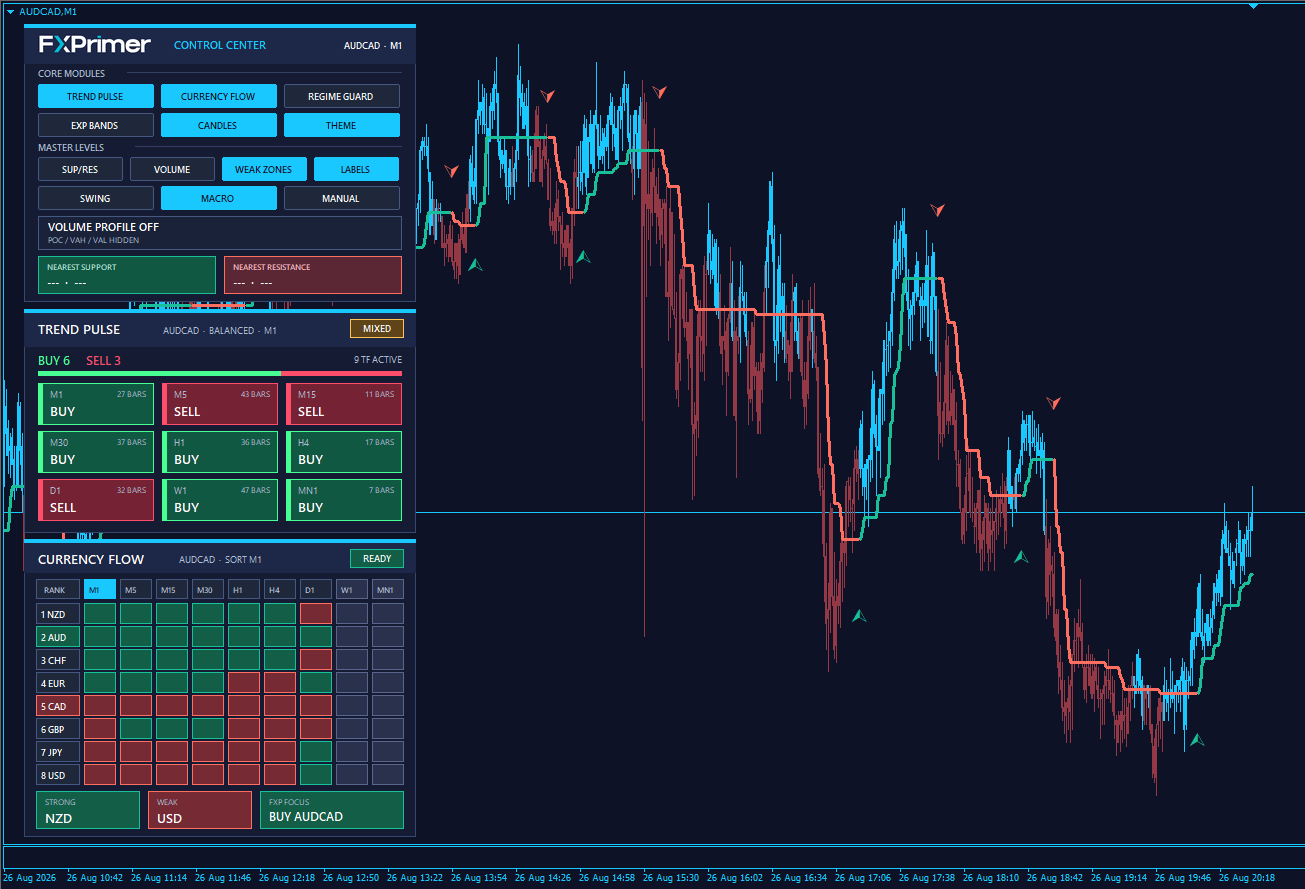
Scenario B — Direction inside compression
Direction is present, but the environment is tighter
ExampleTrend Pulse can remain bullish or bearish while Regime Guard reports compression. This is not an error and does not automatically invalidate the directional state.
Scenario C — Price is already extended
A strong directional picture near an outer extension layer
ExampleA bullish Trend Pulse and favorable Currency Flow relationship can remain valid even when price has already moved deep into the Expansion Bands. The information is not contradictory: one layer describes direction, while the other describes distance from the dynamic center.
Scenario D — Approaching a Master Level
Direction meets structure
ExampleA strong directional move approaching a Proven resistance zone is different from the same move trading in open space. Master Levels does not cancel Trend Pulse; it tells you that price is entering a location with more structural significance.
Scenario E — Volume concentration
Price interacting with POC or Value Area
ExampleVolume Profile can add another location layer. Price approaching POC, VAH or VAL is not automatically a trade trigger, but it tells you where activity has concentrated inside the selected range.
Confluence versus confirmation
Confluence means different pieces of information point toward a compatible market interpretation. Confirmation is often used more rigidly, as if one tool must validate another before an action can be taken. FX Primer is better understood through confluence.
Direction, strength, regime, extension, structure and volume are not copies of the same signal. Their value comes from being different. When several layers support the same interpretation, the picture may become clearer; when they disagree, the disagreement itself can be useful information.
More green or more agreement does not mathematically guarantee a better trade. The suite is designed to improve market reading, not to replace judgment with a fixed number of matching boxes.
Settings & Customization
FX Primer keeps the public settings intentionally focused. The goal is to let users adapt the workspace without exposing unnecessary engine parameters or turning normal setup into a technical configuration exercise.
Use the Control Center for fast on-chart changes. Use the Inputs tab for startup preferences and settings that do not need to change constantly.
Trend Pulse settings
| Setting | What it changes |
|---|---|
| Mode | Selects Reactive, Balanced or Stable as the Trend Pulse response profile. |
| Visual history | Controls how much recent Trend Pulse visual history is drawn on the chart when the final optimized build exposes this setting. |
| Trend Pulse line | Shows or hides the current-chart directional line. |
| Colored Candles | Sets the initial state of the FX Primer colored-candle layer. |
| Reversal arrows | Shows or hides the arrows that mark directional state changes. |
| Enabled timeframes | Chooses which timeframe cards participate in the multi-timeframe dashboard and alignment logic. |
| Dashboard position | Controls the chart corner and X/Y position of the Trend Pulse panel. |
| Theme | Controls whether the FX Primer chart appearance is applied and whether the previous appearance should be restored when appropriate. |
| Notifications | Controls supported popup and push-notification behavior for relevant Trend Pulse events. |
Currency Flow settings
| Setting | What it changes |
|---|---|
| Close-difference bars | Controls the public lookback used by the Currency Flow comparison mode. |
| Sort timeframe | Sets the timeframe used as the main ranking reference. |
| Refresh interval | Controls how often the dashboard refreshes its currency-strength view. |
| Currencies | Lets you include or exclude individual currencies from the matrix. |
| Timeframes | Lets you include or exclude individual timeframe columns. |
| Broker symbol handling | Optional prefix/suffix fields are available for unusual broker symbol naming when automatic detection is not sufficient. |
| Dashboard position | Controls the placement of Currency Flow on the chart. |
Master Levels — Support & Resistance
| Setting | What it changes |
|---|---|
| Zone timeframe | Selects the timeframe used to build the structural zone view. |
| Historical bars analysed | Controls the amount of chart history considered by the structural scan. |
| Show Weak Zones | Sets the initial visibility of lower-strength zones. |
| Show zone labels | Sets the initial visibility of compact zone classifications. |
| Merge overlapping zones | Allows nearby overlapping areas to be presented more cleanly. |
| Label distance | Controls how far to the right the zone labels are positioned. |
Master Levels — Volume Profile
| Setting | What it changes |
|---|---|
| Key levels | Shows or hides POC, VAH, VAL and the supported weighted reference line. |
| Level labels | Shows or hides compact text labels for the published profile levels. |
| Profile width | Controls the maximum visual width of the horizontal profile on the chart. |
| Value Area percentage | Controls the share of profile activity included inside the Value Area. |
| Refresh interval | Controls how frequently the active profile is refreshed. |
| Processing limit | Provides a safety limit for the maximum amount of source history processed in one profile build. |
Visual history
The optimized FX Primer release is designed to separate what needs to be calculated from what needs to be drawn. The public Visual History setting controls how much recent chart history is displayed for the relevant visual modules without exposing or redefining their internal logic.
The planned default is 600 bars, which is enough to cover a broad visible desktop chart while avoiding unnecessary drawing far beyond the area most users inspect.
It is intended to reduce graphical workload. It should not be interpreted as changing the meaning of Trend Pulse, Expansion Bands or the other analytical engines.
Chart Theme
The FX Primer Theme changes the visual appearance of the chart independently from the analytical modules. This includes the background and other chart colors used to create a consistent FX Primer workspace. Colored Candles remain a separate control, so users can keep the theme while returning to standard candles if desired.
Dashboard positioning
Control Center, Trend Pulse and Currency Flow are designed to align as one dashboard stack. X/Y position settings exist primarily for users who need to move the stack because of screen size, platform layout or other chart objects.
Notifications
Where supported, notification settings are intentionally limited to useful Trend Pulse events. FX Primer avoids exposing unnecessary alert controls for every module because not every change in market context should become a notification.
The default configuration is designed to be usable immediately. Customize a setting when you understand what you want to change in your workflow, not because a larger number of options appears more advanced.
Performance
FX Primer combines several analytical modules inside one workspace. The suite is designed to remain responsive by limiting unnecessary drawing, avoiding repeated work where possible and allowing users to disable modules they do not currently need.
Keep the analytical behavior intact and reduce only unnecessary workload. Performance settings should never be treated as a reason to change the market logic of FX Primer.
Recommended configuration
Normal workstation
Use the standard FX Primer defaults and leave Visual History at its planned 600-bar setting.
Lower-performance computer
Reduce Visual History and keep situational modules off until they are needed.
Multiple charts
Remember that every active FX Primer chart adds its own analytical and graphical workload.
Use only the modules you need
The Control Center is also a performance tool. If you are not using Volume Profile or structural zones during a particular analysis, there is no advantage in keeping every optional layer visible on every chart.
Trend Pulse and Currency Flow provide the main directional and strength view.
Enable it when expansion/compression information is relevant to the current analysis.
Enable structural or volume layers when price location becomes important.
Reduce it if you rarely inspect older chart history and want a lighter drawing workload.
Multiple charts
Running FX Primer on one chart is different from running it on ten charts simultaneously. Each chart can require its own multi-timeframe data, dashboards, overlays and optional profile calculations. If you use many charts at once, consider keeping only the modules that are genuinely useful on each chart rather than cloning the maximum configuration everywhere.
Historical data
Some FX Primer modules depend on multi-timeframe or multi-symbol history. A temporary loading state does not necessarily indicate a performance problem: the platform may simply be retrieving data that is not yet available locally.
Currency Flow is especially dependent on having the required Forex pairs and timeframe history. Allow the platform time to synchronize before judging dashboard responsiveness immediately after installation, changing broker or opening symbols that have not been used before.
What FX Primer optimizes internally
The final optimized builds are designed around a simple principle: repeated calculations and graphical redraws should happen only when they are actually needed. Where possible, the suite reuses existing information, refreshes modules at sensible intervals and limits visual history without changing the analytical result the user expects.
If an optimization changes a Trend Pulse state, shifts a structural zone or alters a Volume Profile result when the market data is the same, it is not considered a valid optimization. Correct behavior always takes priority over shaving off a small amount of processing time.
When something feels slow
Wait for historical data to finish loading. First-run synchronization can temporarily make modules appear slower.
Reduce Visual History. This is the first user-facing setting to lower if the chart is drawing more history than you need.
Disable unused optional modules. Volume Profile and structural overlays do not need to remain active on every chart.
Check how many FX Primer charts are open. A large workspace with many simultaneous charts naturally increases platform load.
Restart after major platform changes. After installing files, changing broker data or loading substantial history, a clean platform restart can help normalize the environment.
Trend Pulse Screener
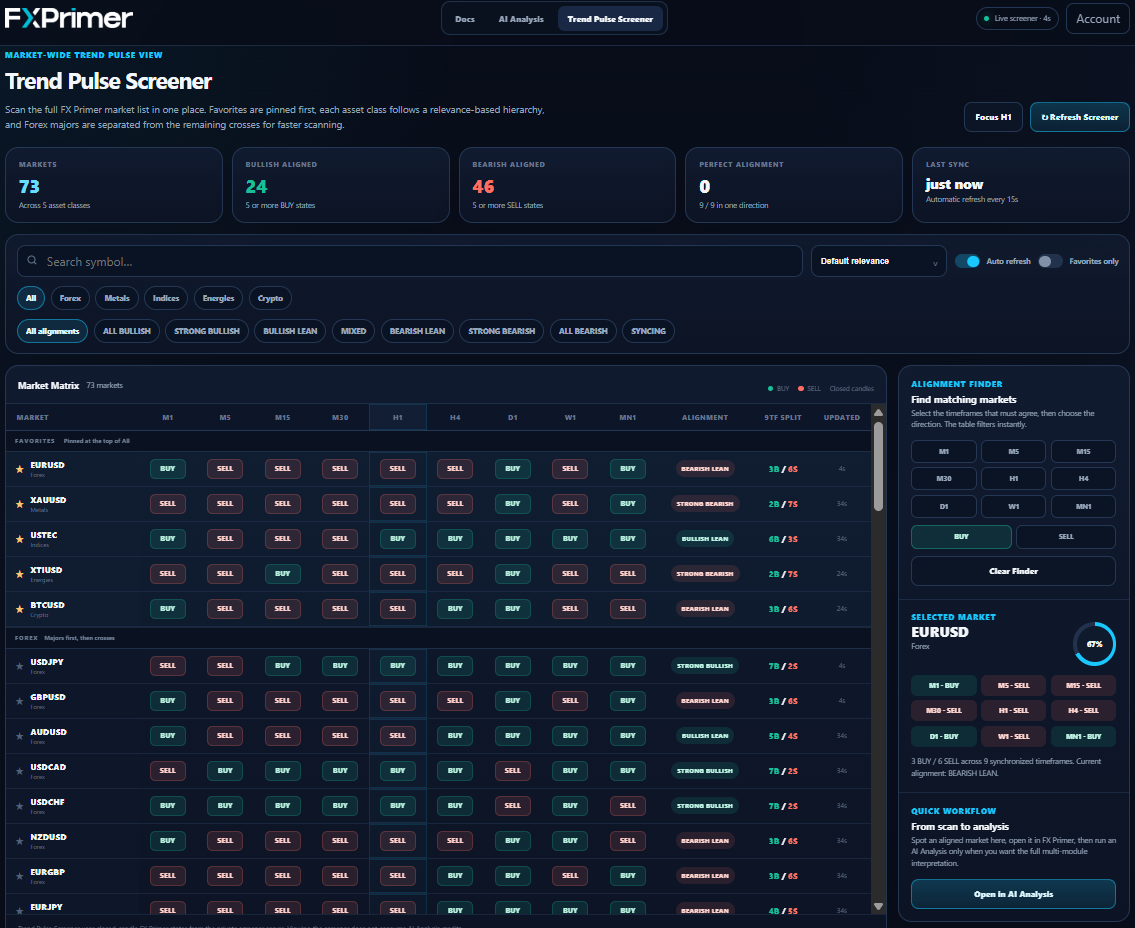
Trend Pulse Screener is the market-scanning layer of FX Primer. It brings the Trend Pulse state of all supported markets into one place, making it possible to compare multi-timeframe direction without opening dozens of individual charts.
Which markets currently show the clearest Trend Pulse alignment, and where should I look next? The Screener is built for discovery and organization. It does not replace the deeper context available on the FX Primer chart or inside AI Analysis.
How the Screener works
The Screener monitors the Trend Pulse state of nine standard timeframes for every supported market:
Each timeframe is shown as BUY or SELL. Screener readings use the last completed candle of the corresponding timeframe, so the matrix is designed around closed-candle states rather than the still-forming candle.
Market Matrix
The Market Matrix is the main workspace. Each row represents one market and each timeframe column shows its current Trend Pulse state. The right side of the row adds a compact alignment summary.
Compare M1 through MN1 without opening the individual market chart.
Shows the total BUY/SELL distribution across the synchronized Trend Pulse timeframes.
Converts the distribution into an easy-to-read description of the current directional structure.
Shows how recently the row was synchronized with the FX Primer screener service.
Understanding Alignment
Alignment describes how strongly the nine Trend Pulse states lean toward one direction. It is a summary of timeframe agreement — not a trading signal and not a probability score.
A market with most timeframes pointing in the same direction will receive a stronger alignment classification. A more balanced BUY/SELL distribution will move toward MIXED.
Finding markets faster
The Screener includes several tools that reduce the time needed to move through a large market list.
Search
Type a symbol such as EURUSD, XAUUSD, BTCUSD or USTEC to filter the matrix immediately.
Favorites
Pin the markets you follow most often. Favorites are organizational only and never affect Trend Pulse calculations.
Market Categories
Switch between All, Forex, Metals, Indices, Energies and Crypto. Within each group, FX Primer uses a relevance-based hierarchy.
Sorting
Reorder markets by Default Relevance, Alignment Strength, Most Bullish, Most Bearish, Symbol A–Z or Recently Updated.
Alignment Finder
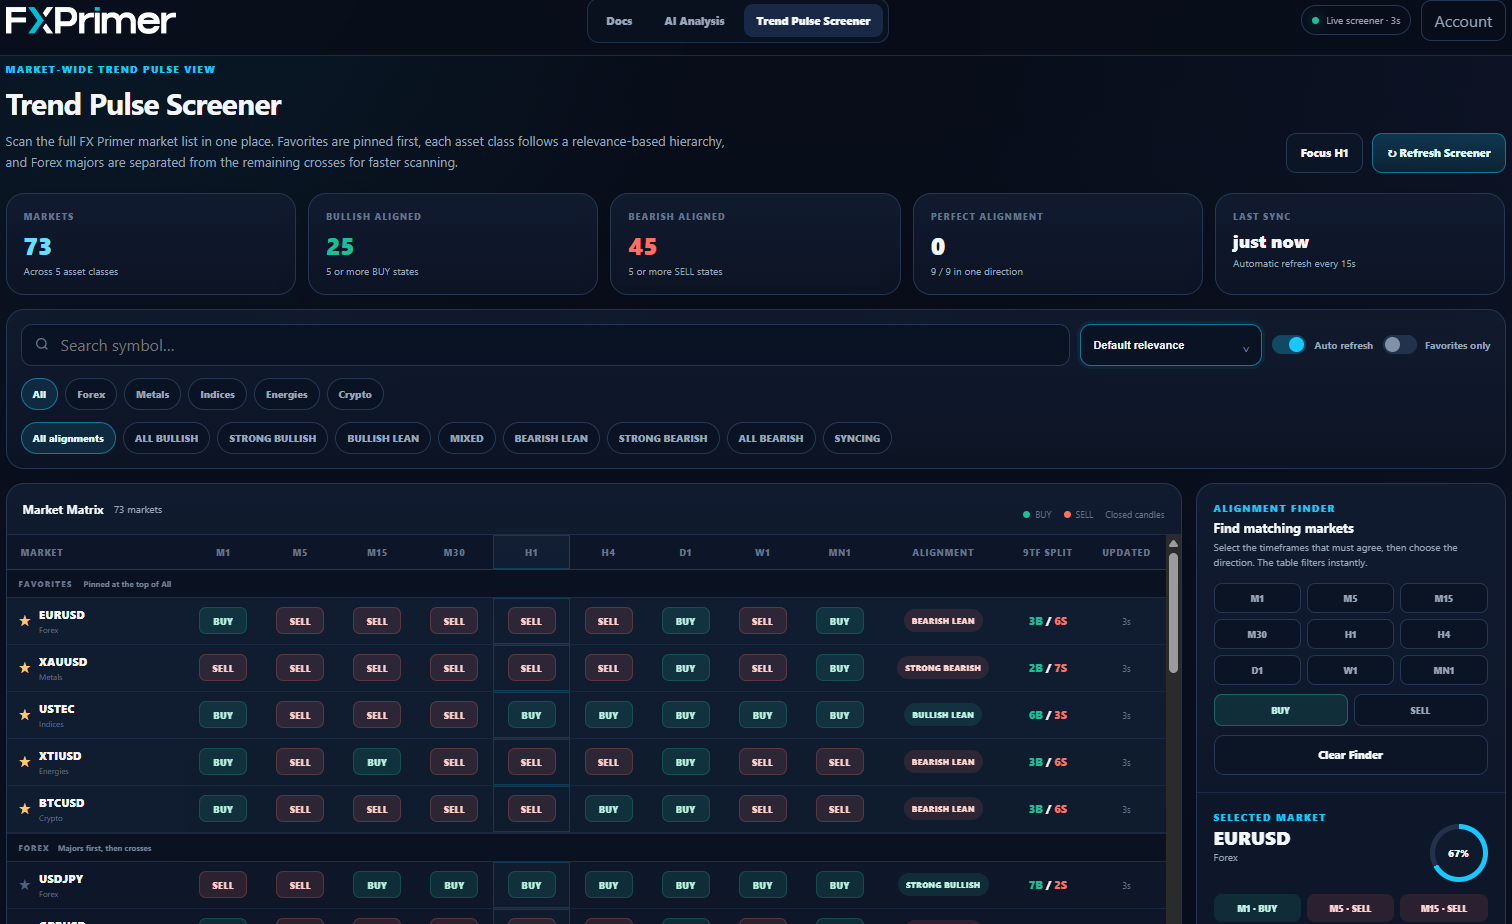
Alignment Finder lets you search for a specific multi-timeframe configuration instead of scanning every row manually. Select one or more timeframes, then choose BUY or SELL. The matrix keeps only the markets where all selected timeframes match the chosen direction.
For example, selecting M15, H1, H4 and D1 with BUY finds markets where all four of those Trend Pulse states are simultaneously BUY. Alignment Finder is only a filter: it does not modify the underlying market data.
Selected Market
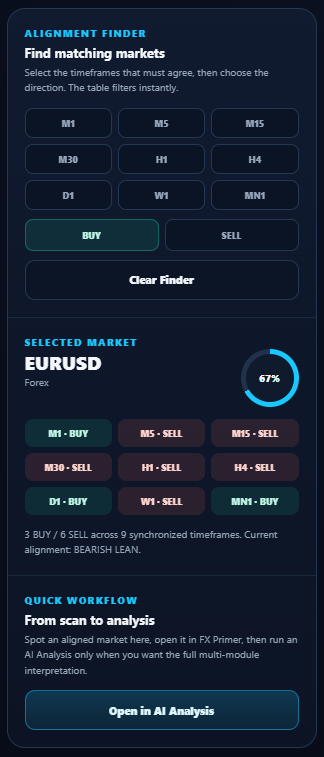
Clicking a market row opens a more detailed summary in the side panel. The Selected Market view includes the symbol, asset category, the nine timeframe states, the BUY/SELL split, the current alignment classification and the percentage represented by the dominant direction.
Focus Timeframe
Focus highlights one timeframe column across the matrix, making it easier to compare the same timeframe across many markets. It changes only the visual emphasis of the Screener and does not alter Trend Pulse states or alignment calculations.
Live data, Refresh & SYNC
The Screener refreshes automatically at regular intervals while the connection is active. Auto Refresh can be temporarily disabled, and Refresh Screener can request an immediate update when needed.
The Screener is receiving updates normally from the FX Primer service.
Updates are arriving, but the connection is behind the expected refresh rhythm.
The Screener is currently unable to receive fresh server data.
The required market/timeframe history is still synchronizing. SYNC is neither BUY nor SELL and is replaced automatically when the state becomes available.
From Screener to AI Analysis
Trend Pulse Screener and FX Primer AI are designed as complementary tools. The Screener helps you decide where to look; AI Analysis helps you understand what the broader FX Primer framework says about that individual market.
Scan
Use the Market Matrix, filters or Alignment Finder to identify a market worth investigating.
Select
Open the Selected Market summary and confirm the exact Trend Pulse structure you found.
Analyze
Use Open in AI Analysis when you want the full multi-module FX Primer interpretation.
Trend Pulse Screener does not use AI models. You can scan, search, filter and refresh the market list without using the daily AI Analysis allowance.
BUY and SELL inside the Screener indicate only the Trend Pulse state of the corresponding timeframe. Multi-timeframe alignment can help organize directional context, but it must not be interpreted by itself as an automatic instruction to open or close a position.
FX Primer AI Analysis
FX Primer AI Analysis is the interpretation layer built above the FX Primer framework. Instead of forcing the user to read Trend Pulse, Currency Flow, Regime Guard, Master Levels, Volume Profile and Expansion Bands separately, it brings the available information together and explains the broader market picture in one structured analysis.
Reduce the time required to interpret several FX Primer modules at once while keeping the final reasoning visible. It highlights confluence, conflict and the conditions that matter most — without turning the platform into an automatic trade-signal generator.
Accessing FX Primer AI
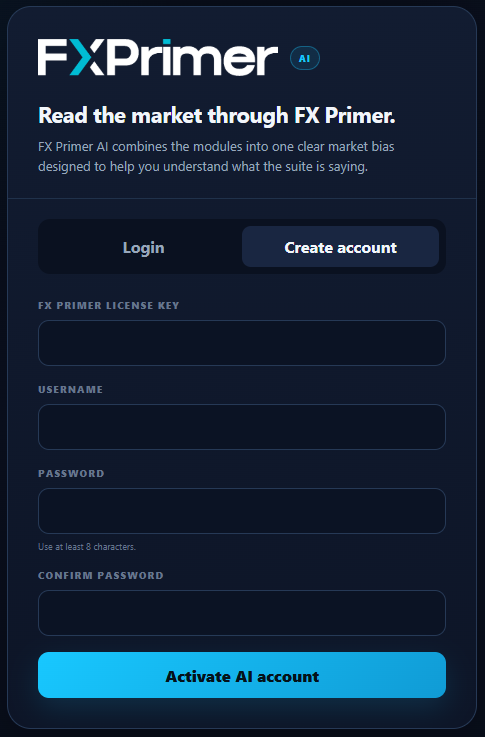
On first access, open the FX Primer AI dashboard and select Create Account. Enter your active FX Primer License Key, choose a personal Username and Password, and complete the registration.
The License Key is required only during the initial registration to verify and activate access to FX Primer AI. Once the account has been created, it remains linked to the FX Primer license. Future access requires only the Username and Password you created.
Generating an Analysis
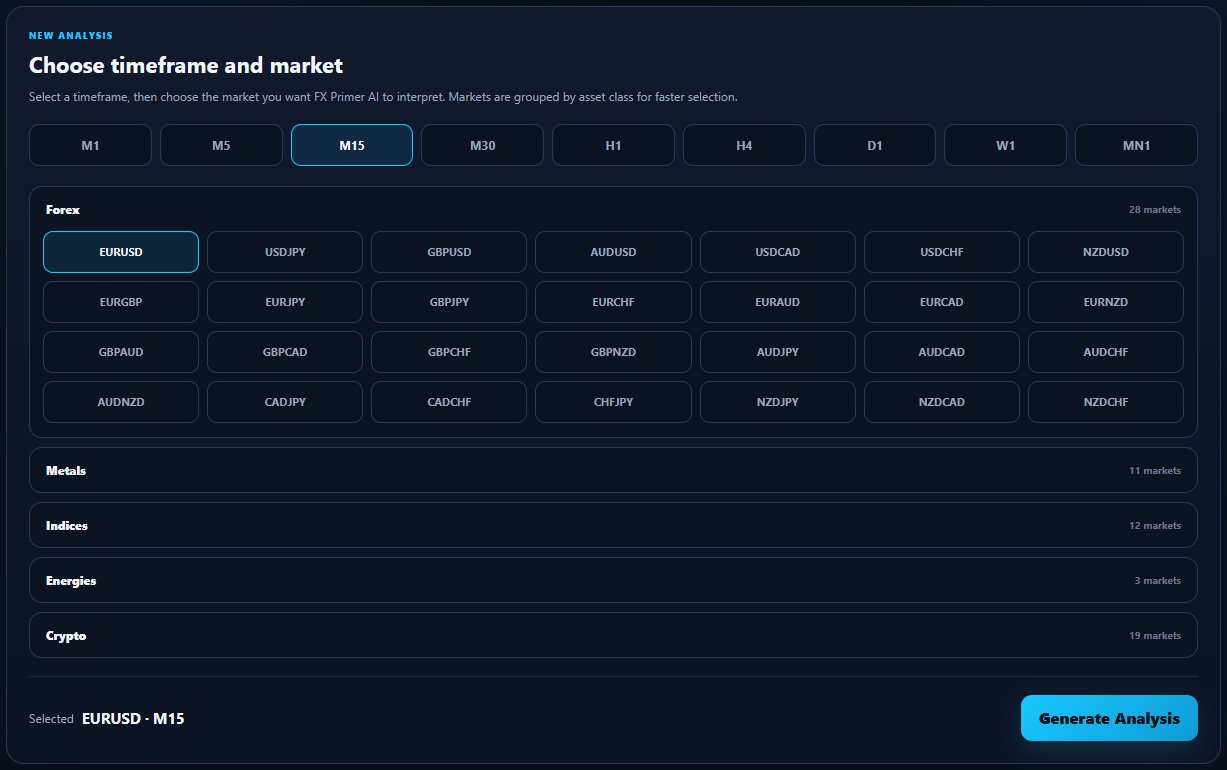
After logging in, select the timeframe first and then the market you want to analyze. The available timeframe range runs from M1 to MN1. Markets are grouped into categories such as Forex, Metals, Indices, Crypto and Stocks where available.
Once the market and timeframe are selected, press Generate Analysis. FX Primer AI then collects the relevant FX Primer readings and progressively interprets the selected market context.
Overall Bias
The first result shown is the Overall Bias: FX Primer AI's directional interpretation of the information currently available from the FX Primer framework.
The bias can range from Strongly Bearish through Neutral to Strongly Bullish, with intermediate Slightly and Moderately states. This is a contextual interpretation — not an instruction to Buy or Sell.
Overall Bias
Summarizes which direction the full FX Primer picture currently leans toward.
Bias Strength
Shows how clearly the current reading leans toward one side. It is not a probability, win rate or statistical forecast.
Why This Bias
Next to the Overall Bias, FX Primer AI explains why it reached that interpretation. The explanation is split into two complementary views.
Highlights the strongest pieces of evidence that reinforce the current directional interpretation.
Highlights nearby obstacles, mixed readings or conflicting modules that prevent the bias from being interpreted more strongly.
This distinction is essential: the goal is not only to know whether the picture is bullish or bearish, but to understand why it is not necessarily more bullish or more bearish.
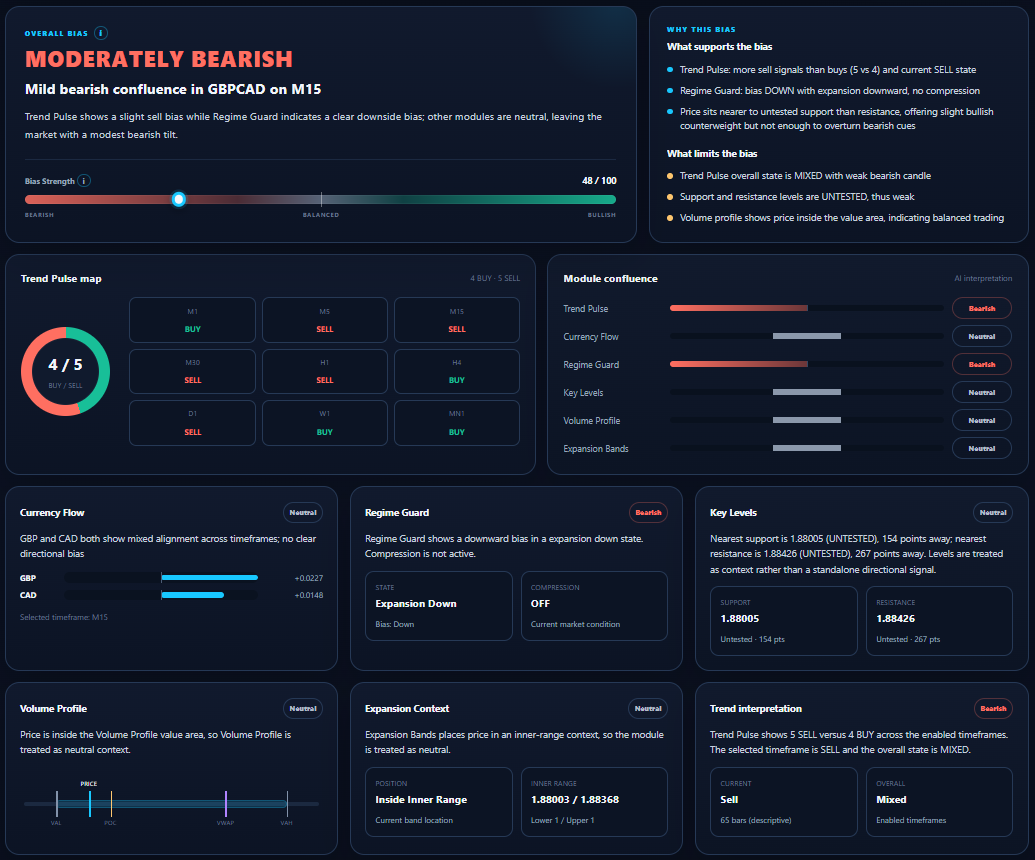
Trend Pulse Map
The Trend Pulse Map transforms the enabled timeframe states into a compact visual overview. The circular distribution summarizes BUY versus SELL states, while the timeframe grid shows exactly where the differences are located.
This makes it easy to distinguish full directional alignment from a mixed picture or a shorter-term pullback against a broader higher-timeframe structure.
Module Confluence
Module Confluence summarizes the AI interpretation of the main FX Primer components as Bullish, Bearish or Neutral. It includes Trend Pulse, Currency Flow, Regime Guard, Key Levels, Volume Profile and Expansion Bands.
It should not be read as a mathematical voting system. Different modules answer different market questions and can carry different contextual importance.
Module-by-module interpretation
Currency Flow
Explains whether the relative relationship between the currencies involved supports or conflicts with the current bias.
Regime Guard
Summarizes whether the current environment is expanding or compressed and how that regime interacts with directional context.
Key Levels
Places nearby support and resistance into context, including whether an obstacle is immediately above or below current price.
Volume Profile
Shows how price is positioned relative to the Value Area, POC and the profile's main reference levels.
Expansion Context
Explains whether price is trading inside the more central range or closer to a more extended band area.
Trend Interpretation
Explains the selected timeframe state in relation to the rest of the Trend Pulse map instead of reading that timeframe in isolation.
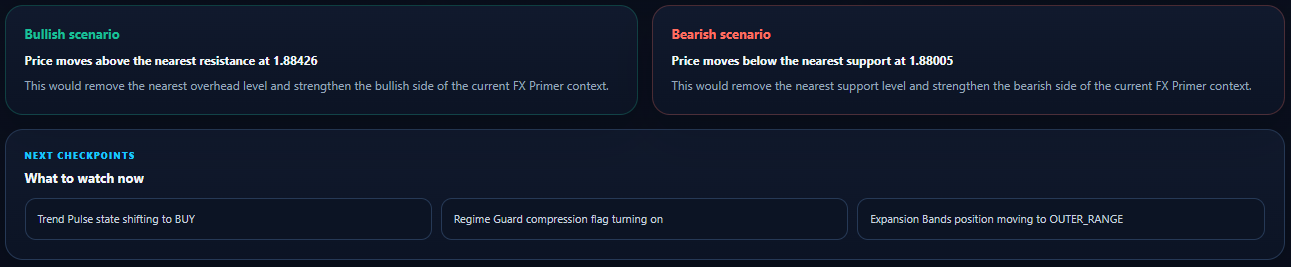
Bullish and Bearish Scenarios
Every completed analysis presents both a Bullish Scenario and a Bearish Scenario. These are not forecasts or orders. They describe the developments that would make one side of the current picture more coherent.
For example, a bullish scenario may depend on price reclaiming an important level or a short-term Trend Pulse state returning into alignment. A bearish scenario may depend on a support break, rejection back into value or deterioration in relative currency flow.
What to Watch
The What to Watch section turns the analysis into a short monitoring list. It highlights the changes most likely to alter the current interpretation — such as a Trend Pulse shift, a support/resistance event, a change in Currency Flow or a move relative to Volume Profile and Expansion context.
Recent Analyses
Recent Analyses lets you reopen previously generated readings directly from the dashboard. Each entry can show the market, timeframe, Overall Bias, a short description and the time of generation.
This is useful when you want to compare a newer market reading with an analysis generated earlier without rebuilding the context manually.
How to use FX Primer AI
Choose market and timeframe
Generate the analysis for the exact context you want to understand.
Read Overall Bias and Bias Strength
Understand the main directional interpretation before looking at individual modules.
Read what supports and limits it
Identify both the strongest confluences and the most relevant conflicts.
Inspect Trend Pulse and Module Confluence
See where timeframe structure and module agreement are coming from.
Check location and extension
Read Key Levels, Volume Profile and Expansion Context before treating a directional bias as actionable context.
Read both scenarios and What to Watch
Understand which future changes would strengthen, weaken or alter the current picture.
Return to the FX Primer chart
Use the AI interpretation to make the full dashboard easier to read — not to replace your own market and risk decisions.
FX Primer AI Analysis is not an operational signal, a guaranteed prediction or personalized financial advice. The Overall Bias is an interpretation of the FX Primer information available at the moment the analysis is generated. Market conditions can change, and a later analysis can therefore produce a different reading.
Troubleshooting
Most FX Primer issues are related to installation, licensing permissions, missing platform history or a module waiting for required data. This section is organized by symptom so you can move directly from what you see on screen to the most likely checks.
Read the exact message shown by FX Primer or MetaTrader. A missing-history state, a license state and a graphical issue have different causes and should not be treated as the same problem.
Installation & licensing
FX Primer License Core does not activate
- Confirm that your License Key has been entered correctly in FX Primer License Core.
- Confirm that the official FX Primer URL has been added to MetaTrader's allowed WebRequest list.
- Confirm that the terminal has an active internet connection.
- Remove and reattach License Core after correcting the settings, if necessary.
License Core should be treated as a normal installation component. There is no need to configure or understand its internal licensing infrastructure.
The Suite loads but the license is not available
Make sure FX Primer License Core is mounted and active before relying on the main Suite. If the license component is missing or cannot validate normally, the protected Suite may not operate as expected.
MetaTrader blocks the FX Primer WebRequest
Open the platform Options, locate the Expert Advisors / WebRequest permission area and add the official FX Primer licensing URL exactly as shown in Getting Started. The installation section includes the reference screenshot.
Currency Flow
Currency Flow shows SYNC, missing data or an incomplete ranking
Currency Flow needs price history for multiple Forex pairs and timeframes. On a fresh platform installation, after changing broker or after opening symbols that have never been loaded before, MetaTrader may need time to retrieve the required history.
- Wait for the terminal to finish downloading historical data.
- Confirm that the relevant Forex symbols are available in Market Watch.
- Allow the dashboard a few refresh cycles after the history becomes available.
My broker uses a prefix or suffix in symbol names
FX Primer attempts to resolve normal broker naming automatically. If the broker uses an unusual naming convention and automatic detection is not sufficient, the Currency Flow input section includes optional prefix/suffix fields.
The currency ranking looks different after changing the sort timeframe
This is expected. The selected sort timeframe changes the main ordering reference. The broader matrix still provides the multi-timeframe picture, but the row order can change when a different timeframe becomes the ranking reference.
Trend Pulse & chart display
Colored Candles are not visible
Check that Candles is enabled in the Control Center and that the related initial setting has not been disabled in Inputs. If the module was just re-enabled, allow the chart a moment to redraw the visible history.
The FX Primer chart theme is missing
Check the Theme button in the Control Center and the corresponding startup setting. Theme and Colored Candles are independent, so one can be enabled while the other is disabled.
Trend Pulse timeframes do not all agree
This is not a malfunction. MIXED is a valid state and simply means the enabled timeframes are not all pointing in the same direction.
Regime Guard
Regime Guard is not visible
Confirm that the Regime Guard companion has been installed and attached to the chart. The Control Center can show or collapse the module, but it cannot display a companion that has not been loaded.
The Regime Guard window is collapsed
When Regime Guard is OFF, its subwindow intentionally collapses to a very small height to avoid occupying chart space. Enable Regime Guard from the Control Center to restore the active window.
The expanded Regime Guard window is not at my preferred height
Supported builds allow the expanded subwindow height to be adjusted manually. Resize it while the module is open; the companion can retain the chosen expanded size for later ON/OFF cycles.
Master Levels & Volume Profile
Support / Resistance zones do not appear
Check that Support / Resistance is enabled in the Control Center and that enough historical bars are available for the selected zone timeframe. Weak Zones can remain hidden independently from the stronger zone set.
Volume Profile is not visible
Confirm that Volume is enabled and that the active profile mode has a valid source range. Manual mode also requires a valid user-defined range on the chart.
POC / VAH / VAL values are not available yet
The active profile must first build successfully from its source data. If the required history is still loading, the Control Center may temporarily show a waiting state instead of final profile values.
Trend Pulse Screener shows SYNC
SYNC means the required market/timeframe data is still being synchronized. It is neither BUY nor SELL and should disappear automatically once the state becomes available.
- Keep Auto Refresh enabled or request a manual Refresh Screener.
- Check the connection indicator at the top of the Screener.
- If only a few cells are affected, allow those markets/timeframes more time to synchronize.
Trend Pulse Screener shows Delayed or Offline
The connection indicator describes whether fresh Screener data is being received normally. Delayed means updates are behind the expected refresh rhythm; Offline means fresh server data is currently unavailable.
- Confirm that the browser has an active internet connection.
- Try Refresh Screener once the connection has recovered.
- Do not treat an old matrix as a fresh market reading while the Screener is Offline.
The Screener and AI Analysis do not show the same directional conclusion
This can be completely normal. Trend Pulse Screener summarizes closed-candle Trend Pulse states across nine timeframes. AI Analysis interprets a broader FX Primer context for one selected market and also considers other available modules.
I cannot create my FX Primer AI account
During first registration, use the active FX Primer License Key linked to your product access and choose your Username and Password. The License Key is used during account creation; normal future logins use the Username and Password you created.
- Check that the License Key has been entered exactly.
- Make sure the password satisfies the requirements shown on the registration screen.
- If the account was already created previously, use Login instead of creating a second account.
AI Analysis does not generate a new analysis
First confirm that a market and timeframe are selected and that your AI account is logged in. Also check the daily usage indicator shown in the AI dashboard.
- If the daily allowance has been reached, wait until usage becomes available again.
- If the dashboard appears stale, refresh the page and sign in again if required.
- If the issue persists, include the selected symbol, timeframe and a screenshot when contacting support.
A previous AI Analysis now looks different from the current market
AI Analysis is a snapshot of the FX Primer information available when that analysis was generated. Market states can change afterward. Generate a new analysis when you need an updated interpretation.
Online Tools — Screener & AI Analysis
General reset checklist
Check the message first. Distinguish licensing, missing history and display problems.
Refresh the platform data. Give MetaTrader time to load required symbols and timeframes.
Verify Control Center states. Make sure the module you expect to see is actually enabled.
Reattach only the affected component. Avoid rebuilding the entire workspace if the issue is isolated.
Restart MetaTrader after installation changes. This is especially useful after replacing files or changing platform permissions.
Glossary
A quick reference for the terms used throughout FX Primer. Definitions are intentionally user-facing: they explain what a term means inside the workflow without exposing proprietary calculation details.
The degree to which the enabled Trend Pulse timeframes share the same BUY or SELL state.
The standard Trend Pulse response profile, designed as the default compromise between responsiveness and stability.
A directional lean used by Regime Guard when describing the current market regime.
A Regime Guard state describing a tighter market environment with less expansive price movement.
Several different FX Primer layers supporting a compatible market interpretation without becoming one mechanical signal.
A Regime Guard state describing a market environment with greater directional activity.
Dynamic chart bands used to visualize progressively greater price extension from the current dynamic range.
The Currency Flow summary relationship built from the current strong-versus-weak context when a valid Forex pair is available.
A broader Volume Profile mode designed to provide higher-timeframe or wider contextual range.
A Volume Profile mode where the analysis range is defined directly by the user on the chart.
The FX Primer module family combining structural support/resistance zones and Volume Profile tools.
A Trend Pulse dashboard state where the enabled timeframes are not all aligned in the same direction.
Point of Control — the profile price area with the greatest activity inside the active Volume Profile range.
A stronger Master Levels zone classification indicating greater structural evidence within the zone engine.
The most responsive Trend Pulse profile, intended for users who prefer faster directional state changes.
The most filtered Trend Pulse profile, intended for users who prefer fewer directional state changes.
The default rolling Volume Profile mode used for normal working context.
A Master Levels role-reversal classification where a structural area changes from support to resistance or vice versa.
A recognized structural zone that has not yet received a meaningful retest after formation.
Value Area High — the upper boundary of the selected Volume Profile Value Area.
Value Area Low — the lower boundary of the selected Volume Profile Value Area.
The region of the active Volume Profile containing the selected share of profile activity.
A Master Levels zone classification showing additional market interaction supporting the zone's relevance.
The user-facing limit controlling how much recent graphical history is drawn by relevant FX Primer visual modules.
A volume-weighted reference price shown by supported Volume Profile configurations.
A lower-strength support/resistance zone that can be shown or hidden independently from stronger Master Levels zones.
FX Primer's online interpretation tool for a single selected market and timeframe. It combines the available FX Primer context into an Overall Bias, module interpretation, scenarios and checkpoints.
Trend Pulse Screener filter that keeps only markets where the selected timeframes simultaneously match the chosen BUY or SELL direction.
A visual measure of how strongly the current AI interpretation leans toward one side. It is not a probability, expected return or win rate.
A completed timeframe candle. Trend Pulse Screener uses closed-candle Trend Pulse states rather than the still-forming candle.
AI Analysis summary showing how the main FX Primer modules currently contribute to the broader interpretation as bullish, bearish or neutral context.
The main directional interpretation produced by FX Primer AI for the selected market and timeframe.
Saved AI Analysis entries that can be reopened from the online dashboard.
Trend Pulse Screener side panel showing the chosen symbol, nine timeframe states, BUY/SELL split and current alignment summary.
Temporary Screener state indicating that the required market/timeframe data is still synchronizing. SYNC is neither BUY nor SELL.
FX Primer's market-wide scanning tool for comparing closed-candle Trend Pulse states across supported markets and nine timeframes.
AI Analysis checkpoint list highlighting the market changes most likely to strengthen, weaken or alter the current interpretation.
Frequently Asked Questions
Short answers to the questions users are most likely to ask after installation or during normal use.
Which Trend Pulse mode should I use?
Balanced is the recommended default. Reactive is more responsive, while Stable is more filtered. There is no universally “best” profile for every user and every market.
Do all Trend Pulse timeframes need to align?
No. Full alignment is one type of directional context, not a mandatory condition for using FX Primer. MIXED is a normal and informative state.
Do I need to keep every FX Primer module enabled?
No. The suite is modular by design. Keep the layers that are useful to your current analysis and enable additional context when needed.
Can I use FX Primer on Gold, indices or crypto?
The chart-based modules can be applied to supported market symbols available in the platform. Currency Flow is specifically designed around currency relationships and therefore applies to the Forex currency universe rather than acting as a generic strength matrix for every asset class.
Can I use FX Primer on more than one chart?
Yes, subject to your license terms and platform resources. Remember that each additional chart increases data, calculation and drawing workload.
Are Expansion Bands support and resistance?
No. Expansion Bands describe price extension. Master Levels support/resistance zones describe market structure. The two can overlap, but they are not the same concept.
Does an outer Expansion Band mean price must reverse?
No. Strong directional markets can remain extended or move beyond an outer layer. The bands add context; they do not guarantee mean reversion.
Does compression mean I should not trade?
No. Compression identifies a market regime. It may affect how you interpret directional movement, but it is not a universal prohibition.
Does a POC or Value Area level guarantee a reaction?
No. POC, VAH and VAL are reference levels derived from the active profile distribution. Price can react, balance around them or trade through them.
Why can FX Primer look different on two brokers?
Different brokers can provide slightly different price histories, symbol naming and available data. Those differences can affect chart-derived calculations and historical context.
Can I disable the FX Primer chart theme?
Yes. Theme and Colored Candles are separate controls, so you can keep the analytical suite while using a different chart appearance.
Do I need FX Primer License Core running?
License Core is the component responsible for activating and maintaining the FX Primer license. It should be installed and used as described in the Getting Started section.
Does Trend Pulse Screener consume my AI Analysis requests?
No. Trend Pulse Screener does not use AI models. Searching, filtering, refreshing and using Alignment Finder do not consume the daily AI Analysis allowance.
What is the difference between Trend Pulse Screener and AI Analysis?
The Screener helps you scan many markets quickly using Trend Pulse alignment. AI Analysis goes deeper on one selected market and interprets the broader FX Primer framework, including other available modules.
Is the Screener alignment percentage a probability of a winning trade?
No. It only describes the share of synchronized Trend Pulse timeframes pointing in the dominant direction. It is not a probability, confidence interval or expected win rate.
Why does the Screener sometimes show SYNC instead of BUY or SELL?
SYNC means the required data for that market/timeframe is still being synchronized. Once the state is available, SYNC is replaced automatically by BUY or SELL.
Do I need to enter my License Key every time I log in to FX Primer AI?
No. The License Key is used during initial account creation. After registration, normal access uses the Username and Password linked to that FX Primer AI account.
Is Overall Bias an automatic trading signal?
No. Overall Bias is an AI interpretation of the FX Primer information available when the analysis is generated. It does not define entry, exit, stop placement or position size.
Is Bias Strength a probability?
No. Bias Strength only communicates how strongly the current AI interpretation leans toward one side. It must not be interpreted as a win probability or forecast accuracy score.
Why can a new AI Analysis differ from an older one?
Each analysis reflects the FX Primer market context available at the time it is generated. Trend states, regime, structure, volume context and price location can change, so a later analysis can legitimately produce a different interpretation.
Risk & Usage
FX Primer is an analytical software product. This includes the chart Suite, Trend Pulse Screener and FX Primer AI Analysis. They organize and interpret market information, but trading decisions, execution and risk remain the responsibility of the user.
No indicator, Screener alignment, AI bias, structural zone or volume level can guarantee a future market outcome.
Analytical tool
FX Primer is designed to support chart analysis and market interpretation. It is not an automated investment-management service.
User responsibility
The user remains responsible for deciding whether, when and how to trade, including entry, exit and position sizing.
No guaranteed outcome
Historical behavior, directional alignment and technical confluence do not guarantee future profitability.
Use multiple dimensions
FX Primer is intentionally modular because market direction, regime, extension, structure and volume answer different questions.
Interpretation, not execution
Trend Pulse Screener classifications and FX Primer AI outputs are designed to improve market reading. They do not automatically create, manage or close trades.
Only trade with capital and risk exposure appropriate to your circumstances. The full commercial Terms, licensing conditions and any jurisdiction-specific legal disclosures should remain separate from this user guide where appropriate.
Updates & Support
FX Primer is designed as an evolving software product. The documentation, installation package and analytical Suite may be updated over time as features are refined or new platform versions are released.
Documentation versioning
The online guide should always be treated as the current documentation source. Because the documentation is hosted as a living HTML resource, wording, screenshots and troubleshooting guidance can be updated without requiring users to download a new PDF after every product revision.
FX Primer version
The Suite build identifies the installed product version. Major documentation changes should reference the corresponding release where needed.
Documentation version
The documentation can maintain its own revision number so support changes do not need to match every small code update.
Product updates
When an update changes visible behavior, settings, installation steps or module interpretation, the related documentation section should be updated at the same time. Pure internal performance improvements do not need to create unnecessary user-facing documentation changes when the visible behavior remains the same.
Getting support
For product assistance, use the official FX Primer support address below. Including the relevant product area, screenshot and exact status/error message helps make troubleshooting faster.
Official FX Primer Support
support@fxprimer.com
FX Primer Website
www.fxprimer.com
Before contacting support
Read the exact error or status message. Include it in your request.
Specify MetaTrader 4 or MetaTrader 5. One guide covers both platforms, but support still needs to know which terminal you are using.
Include the FX Primer version. This helps distinguish current behavior from an older build.
Include the symbol and timeframe. Especially useful for chart, history or module-display issues.
Add a screenshot when the issue is visual. A chart screenshot often explains more than a long written description.
For online-tool issues, identify the exact area. Specify whether the problem concerns Trend Pulse Screener or FX Primer AI Analysis, and include the browser-visible status where relevant.
Appendix
A compact reference for recurring interface conventions and product terminology. The appendix intentionally avoids proprietary internal formulas and focuses only on information useful to the end user.
FX Primer module map
| Module | Primary role |
|---|---|
| Control Center | Workspace control and compact operational information. |
| Trend Pulse | Direction and multi-timeframe directional structure. |
| Currency Flow | Relative currency strength and ranking. |
| Regime Guard | Expansion, compression and directional bias. |
| Expansion Bands | Progressive price-extension context. |
| Support & Resistance | Structural price zones and nearest-level context. |
| Volume Profile | Distribution-based price activity and key reference levels. |
| License Core | License activation and license validity. |
| Trend Pulse Screener | Market-wide Trend Pulse scanning, filtering and multi-timeframe alignment discovery. |
| FX Primer AI | Single-market multi-module interpretation, scenarios and checkpoints. |
Trend Pulse modes
Reactive
Faster directional response with more frequent state changes.
Balanced
The standard working profile and recommended starting point.
Stable
Slower, more filtered directional behavior.
Volume Profile modes
Swing
Rolling recent-market context.
Macro
Wider adaptive market context.
Manual
User-defined profile range.
Color language
Used throughout FX Primer for positive, bullish or primary-accent information depending on the module.
Used for bearish, negative or upper-extension information depending on the module.
Used for neutral, compressed, inactive or secondary information.
Primary text and high-contrast interface information.
Trend Pulse Screener
Scan many markets using closed-candle Trend Pulse states and alignment filters.
Alignment Finder
Filter the market list by a precise BUY or SELL combination across selected timeframes.
Overall Bias
Read the broader FX Primer interpretation for one selected market and timeframe.
Open in AI Analysis
Move from market discovery in the Screener to deeper multi-module interpretation.
Online Tools quick reference
Interaction reference
Trend Pulse timeframe card
Switches the active chart to the selected timeframe.
Control Center button
Shows, hides or changes the related FX Primer module or mode.
Manual profile range
Adjusts the custom Volume Profile range directly on the chart.
Regime Guard subwindow
Supported builds allow the expanded Regime Guard window to be manually resized.
Screener market row
Opens the Selected Market summary for that symbol.
Alignment Finder
Keeps only markets matching the selected timeframe-direction combination.
Open in AI Analysis
Transfers the selected market into the AI Analysis workflow for deeper interpretation.
Future FX Primer releases can extend this guide with new modules, screenshots, platform-specific notes or additional troubleshooting without changing the overall documentation structure.